 |
| About Bioline | All Journals | Testimonials | Membership | News |
|
||||||
|
||||||
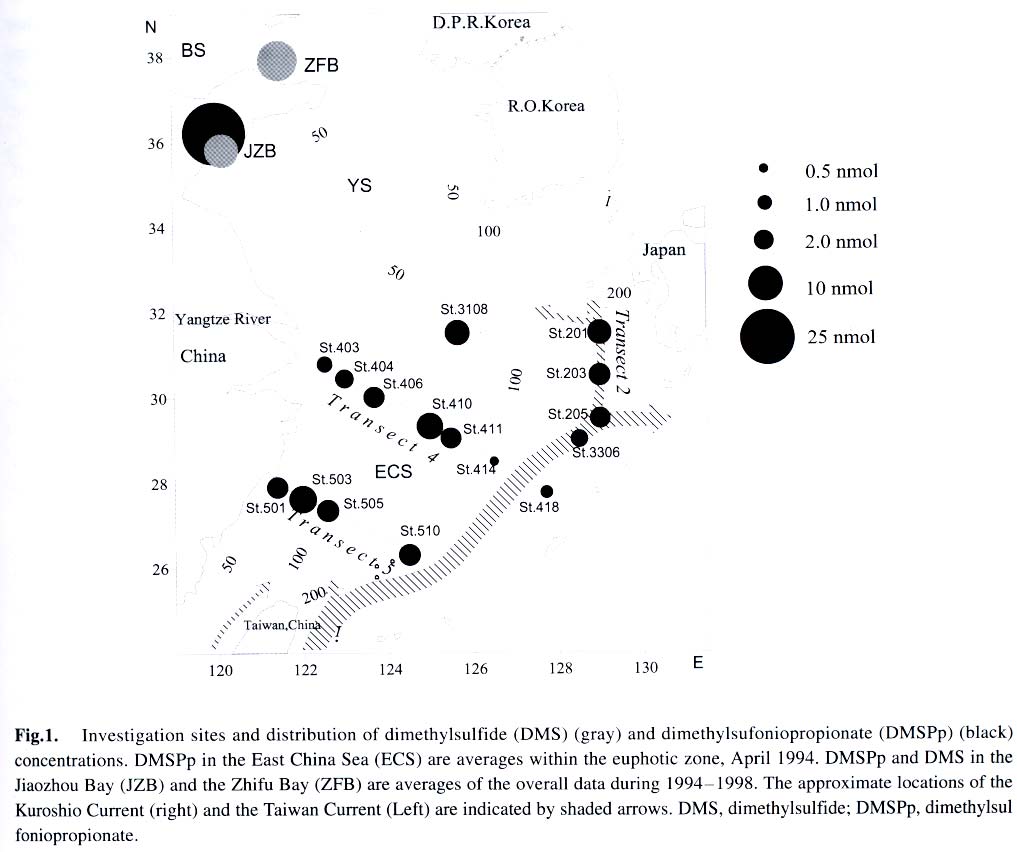
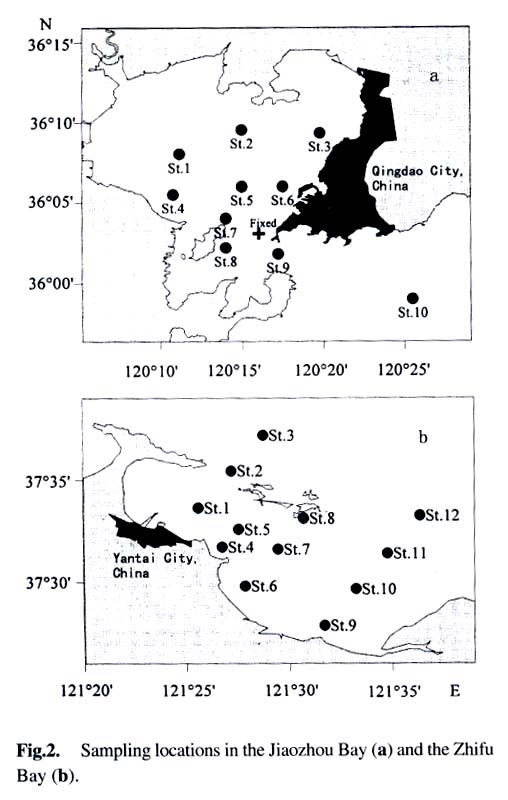
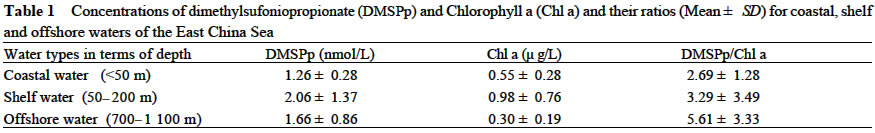
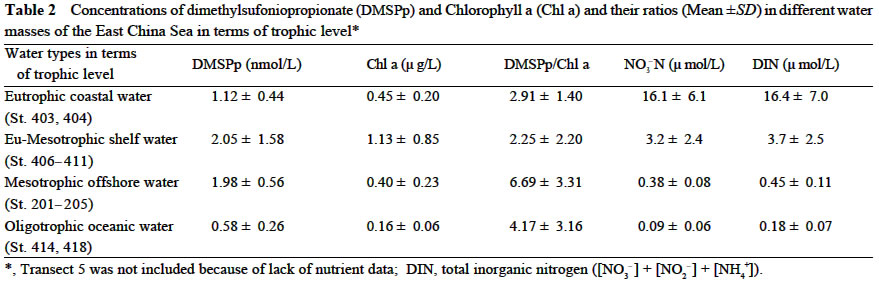
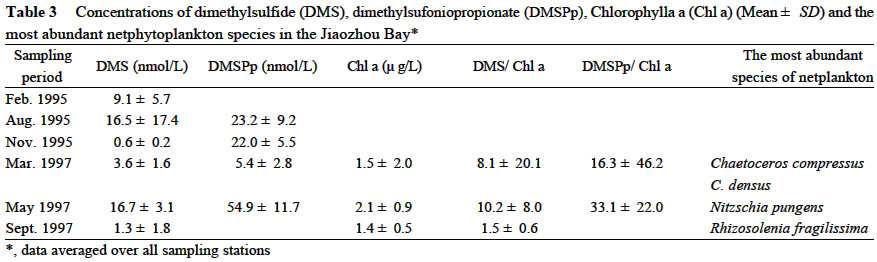
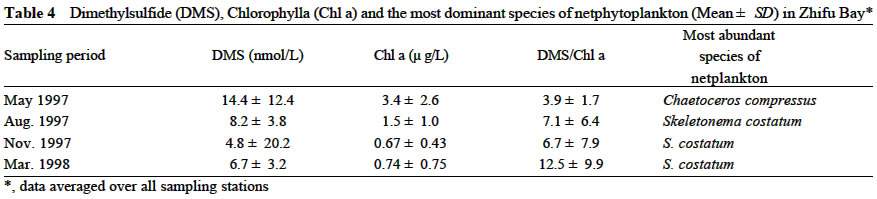
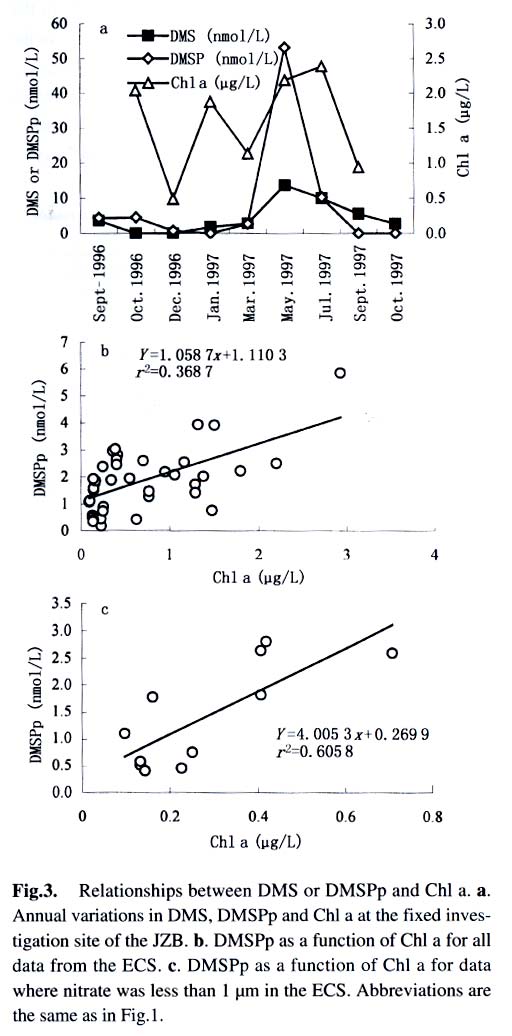
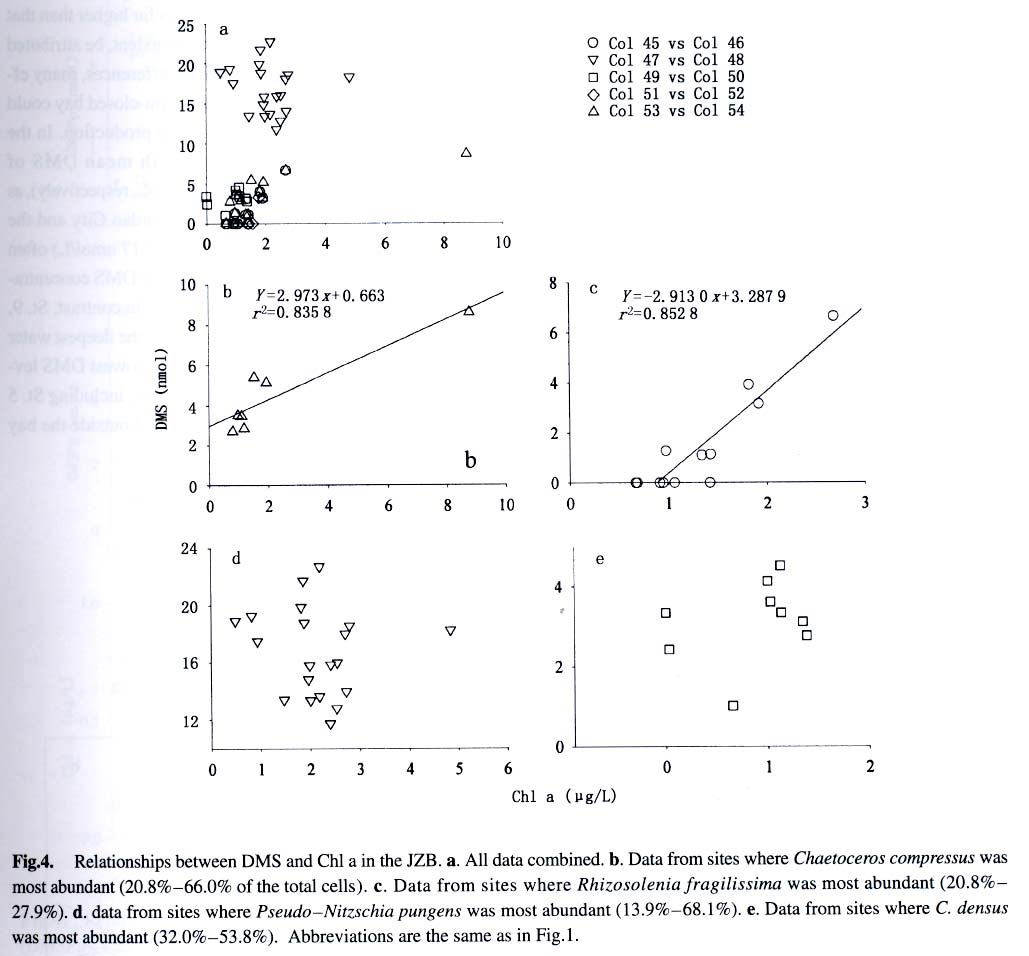
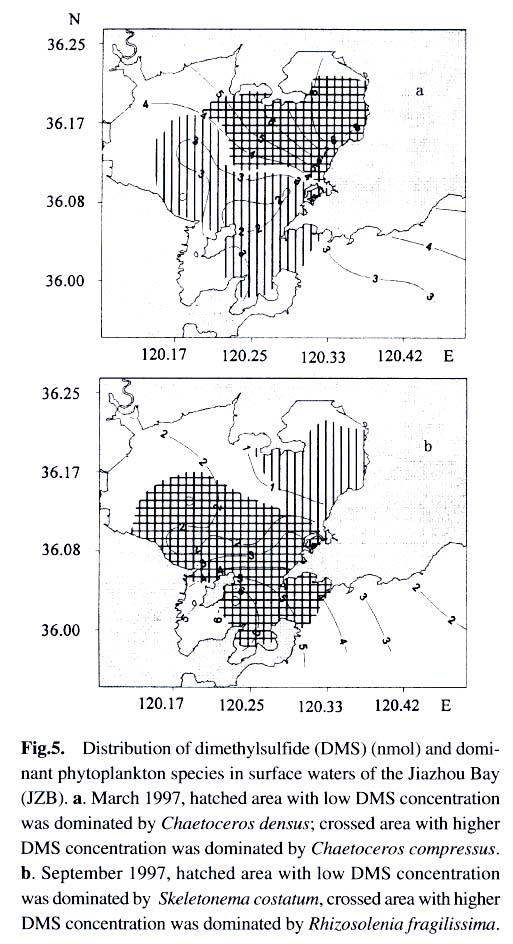
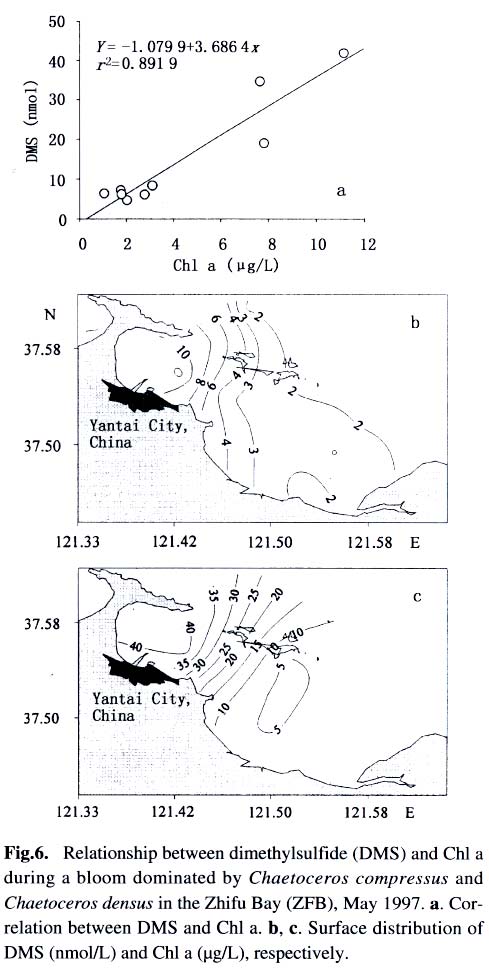
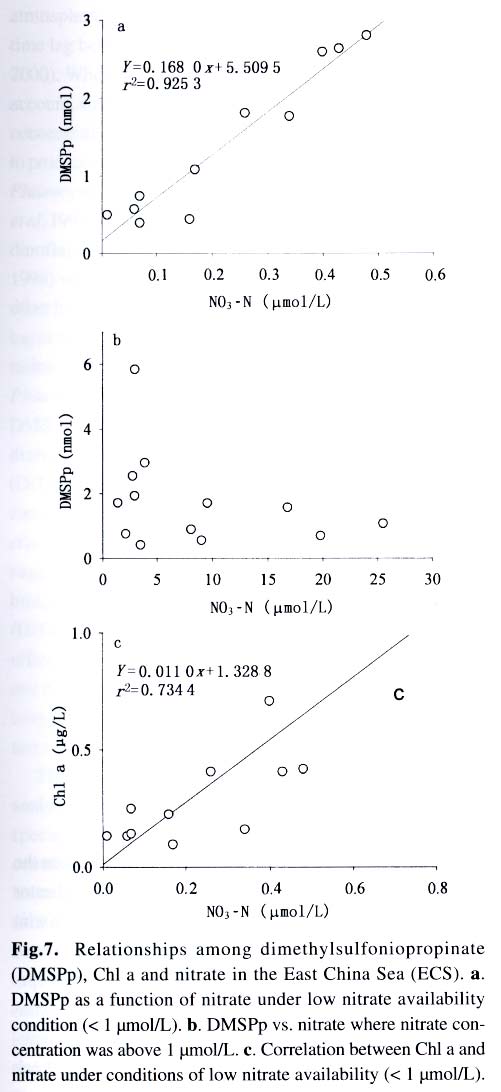
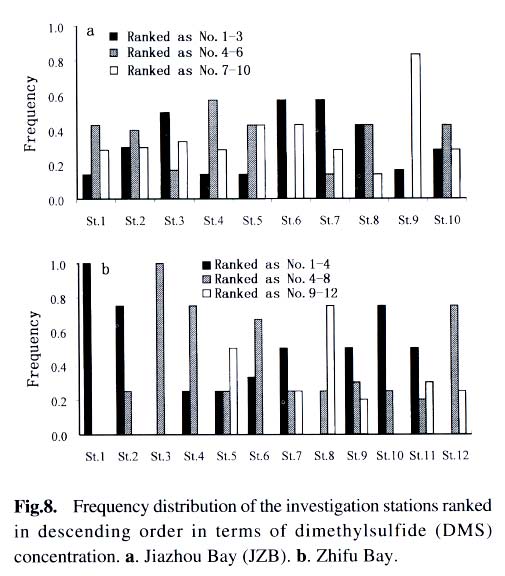
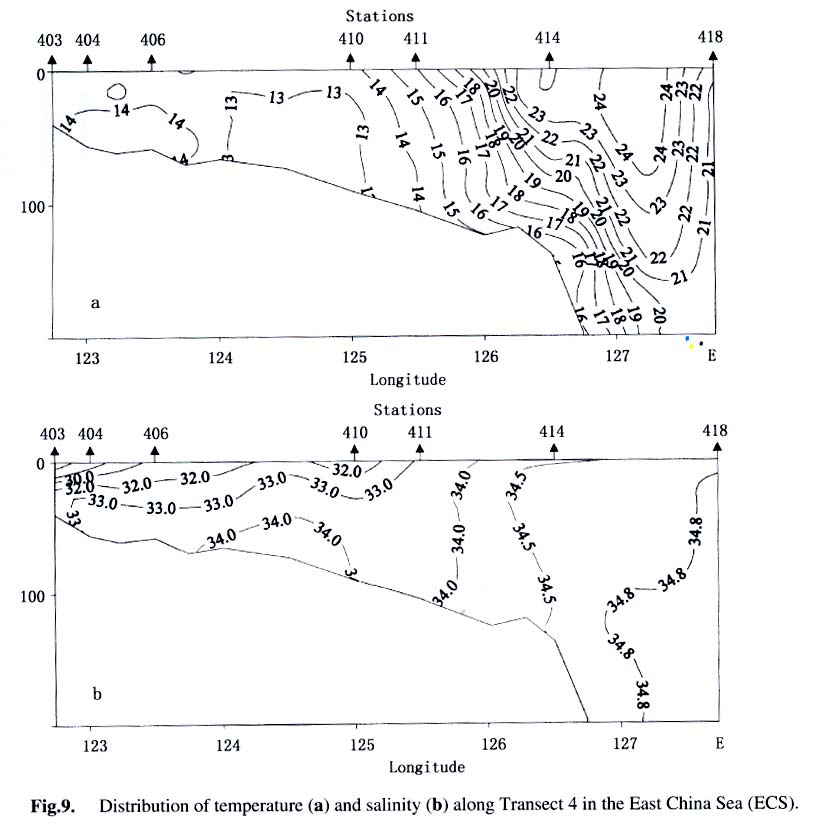
Acta Botanica Sinica, Vol. 45, No. 7, 2003, pp. 774-786 Dynamics of Dimethylsulfide and Dimethylsulfoniopropionate Produced by Phytoplankton in the Chinese Seas — Distribution Patterns and Affecting Factors JIAO Nian-Zhi1,2*, LIU Cheng-Zheng2, HONG Hua-Sheng1, Shigeki HARADA3, Horoshi KOSHIKAWA3, Masataka WATANABE3 (1. Key Laboratory of Ministry of Education for Marine Environmental Sciences, University of Xiamen, Xiamen 361005, China; Received: 2002-09-12 Accepted: 2003-01-16 Code Number: as03005 ABSTRACT Distribution of dimethylsulfide (DMS) and/or particulate dimethylsulfoniopropionate (DMSPp) concentrations in the Jiaozhou Bay, Zhifu Bay and East China Sea wereinvestigated during the period of 1994 -1998. Both DMS and DMSPp levels showed remarkable temporal and spatial variations. High values occurred in the coastal or shelf waters and low values in the offshore waters. The highest levels were observed in spring or summer and lowest in autumn. DMS or DMSPp distribution patterns were associated with water mass on a large geographical scale, while biological and chemical factors were more likely influential on smaller-scale variations. Diatoms could play an important role in total DMS or DMSPp abundance in coastal waters. Nitrate was found to have a two-phase relationship with DMSPp concentrations: positive when nitrate concentration was lower than 1 µmol/L, and negative when it was above. Anthropogenic factors such as sewage input and aquaculture also showed influences on DMS or DMSPp concentration. Key words: dimethylsulfide (DMS); particulate dimethylsulfoniopropionate (DMSPp); nitrogen; diatoms; Chinese seas Dimethylsulfide (DMS) is a sulfur-containing trace gas, whose precursor, dimethylsulfoniopropionate (DMSPp), is produced principally by marine phytoplankton (Malin et al, 1992; Zimmer-Faust et al, 1996; Gage et al, 1997) and considered to be involved in cell osmotic regulation (Gröne and Kirst, 1991). DMSPp contributes most of the sulfur fluxes and substaintial portion of the carbon fluxes (Simó et al, 2002), and marine DMS emission is an important source of cloud condensation nuclei and thus may provide a negative feedback to global warming through the effect of clouds on the earth’s radiative balance (Turner and Liss, 1983; Andreae, 1990; Gröne and Kirst, 1992; Ganor et al, 2000). It has drawn much attention from oceanographers over the past decade, and many studies have addressed the distribution DMS and DMSPp and the processes controlling their dynamics in the world oceans (Turner et al, 1988; Leck et al, 1990; Turner et al, 1996; Simó and Pedros- Alio, 1999; Kiene and Linn, 2000). These literature indicate that the DMS distribution varies markedly both spatially and temporally, and that the mechanisms responsible are often situation-specific. Therefore, field data from a variety of marine ecosystems are desired for a better understanding of DMS production processes and the role of marine DMS in global climate change. The East China Sea (ECS), the Yellow Sea (YS) and the Bohai Sea (BS) are located on the west margin of the North Pacific. The continental shelf in this region is wide and there is large freshwater input (9.73 × 10¹¹ m3/a) from two big rivers, the Yangtze and the Yellow Rivers (Gao et al, 1992). Ecological interest has been focused on these seas because of their diverse environmental conditions. However, there have been no documentation on DMSPp in these areas, and field studies on DMS are only two cases in the ECS (Uzuka et al, 1996; Yang et al, 1996). In terms of the factors controlling dynamics of DMS, Uzuka et al (1996) reported some fairly good correlations between DMS and chlorophyll a (Chl a) in the ECS, suggesting that nutrients could be an important factor in controlling DMS dynamics via regulating biological activities especially in summer. The variations in DMS concentration have been supposed to be correlated with the distribution of phytoplankton, light-dependent rates of photosynthesis , decomposition by bacteria, photochemical oxidation, the rate of volatilization to the atmosphere and ocean current (Yang et al, 1996) . However, data supporting the theory are still rare, further field investigations are desired especially for the western Pacific marginal seas. In the present study, we report the results of ecological surveys in the ECS; the Jiaozhou Bay (JZB), a waterbody adjacent to the YS; and the Zhifu Bay (ZFB), a neritic area of the BS. The purpose was to understand the factors controlling the dynamics of dissolved DMS and particulate DMSPp in these waters characterized by varied water masses as well as pressures of aquaculture and other anthropogenic disturbances. In particular, we examined the roles of diatoms, the most dominant phytoplankton taxa, in DMS and DMSPp dynamics in these coastal waters. Previous studies have proved that the prymnesiophyte Phaeocystis pouchetii, the coccolithophores Emiliania huxleyi and the dinoflagellates Gymnodinium and Katodium are important DMS/DMSPp-producers (Turner et al, 1988; Keller, 1989; Matrai and Keller, 1993; DiTullio and Smith, 1995; Townsend and Keller, 1996). Diatoms have not been shown to be strong producers although they might play an important role in DMS/DMSPp production in coastal waters (Keller, 1989; Baummann et al, 1994). We also examined the “nitrogen deficiency effect” suggested by previous ecological and physiological experiments (Turner et al, 1988; Gröne and Kirst, 1992; Kiene and Gerard, 1995) using a nutrient gradient between coastal and oceanic waters. 1 INVESTIGATION SITES AND SAMPLING In the ECS (Fig.1), DMSPp was investigated during the Chinese Joint Global Ocean Flux Studies (JGOFS) cruise in April of 1994, along three transects (Transects 2, 4, and 5) and two additional sites (Station (St.) 3108, 3306). Transect 2 was along a branch of the Kuroshio Current in the northeastern region of the sea. Transect 4 was from the Yangtze River estuary across the shelf water to the southeastern edge of the ECS in the Kuroshio Current. Transect 5 was in the southern region of the ECS from the coast to its southeastern edge. Three water zones were included in the investigation areas: the coastal zone, less than 50 m in depth (St. 403, 404, 501); the shelf zone, 50 to 200 m (St. 406-414, 503-510 and 3108); and the offshore zone, 700 to 1 000 m (Transect 2 and St. 418, 3306). Samples for DMSPp and Chl a were taken from all the stations at 3 to 5 depths within the euphotic zone (defined as 1% of surface irradiation), which ranged in depth from around 15 m in the estuarine areas to about 50 m in the Kuroshio area. Samples for nutrients were only taken at Transect 2 and 4 at the same depths. The JZB is a semi-closed bay adjacent to the YS, with an area of 39 000 hectares and a mean depth of 7 m. Surrounded by the cities of Qingdao, Jiaozhou and Jiaonan, it has been impacted by human activities. Nine stations inside the bay (St.1-9) and one station outside the mouth of the bay (St. 10) in the western edge of the YS (Fig.2a) were sampled in February, August and November 1995 for DMS and DMSPp, and March, May and September 1997 for DMS only. Parallel samples were also taken for Chl a and nutrients. Samples were collected at 2 to 3 m depths from the surface to about 3 m above the seabed (down to 37 m). In addition, monthly surface water sampling for DMS, DMSPp and Chl a was done by ships-of-opportunity across the mouth of the bay from September 1996 to September 1997 (Fig.2a). The ZFB is located on the southern edge of the BS along the Yantai City coast. It is a typical neritic aquacul-ture area in North China. During the study period, there was active and widespread cultivation of Clamys farreri, Mylitus edulis, and Laminaria japonica around St. 4, 6, 8 and 9. Sampling was carried out at 12 stations in May, August, November 1997 and March 1998 in the surface, middle and bottom layers (down to 20 m in depth) for DMS, Chl a and nutrients (Fig.2b). 2 MATERIALS AND METHODS Ten L Niskin bottles were used for field sampling. For DMS measurements, aliquots of 60 mL seawater were collected in polyethylene bottles without headspace and stored at –30 oC. Samples were analyzed as soon as possible (within the sampling day) to reduce storage artifacts. No prior filtration was applied for DMS analysis to avoid errors by DMS release via cell lysis during filtration (Turner et al, 1988). DMS and DMSPp were measured following the “Headspace-GC” procedures described by Wang and Jiao (1996). For seawater DMS measurement, a modified 50 mL syringe sealed with a silicon rubber lid padded with Teflon membrane was employed as a gas-liquid equalizer. Ten mL seawater sample added with 4 g NaCl (to reduce the solubility of DMS in water), and 10 mL clean air (1:1, liquid:gas ratio) were taken into the equalizer and kept at 40 °C(water bath) for 15 min to enable dissolved DMS into the headspace and subsequent equilibration. One to three mL headspace gas from the equalizer was injected into a gas chromatograph (GC-9A Shimadzu) equipped with a flame photometric detector and analyzed in a 1.6 m × 3.2 mm glass column filled with 60-to 80-mesh chromosorb under the following conditions: column temperature, 80 °C injector temperature and detector temperature, 150 °C; carrier gas (N2) flow rate, 60 mL/min; and air and hydrogen flow rates, 60 mL/min. The detection limit was 0.3 nmol/L DMS. Relative error and relative standard deviation were below 6%. For DMSPp, immediately after sampling, water samples (500 mL) were filtered (Whatman GF/F) under a vacuum of less than 0.03 MPa, and stored at –30 °C until laboratory analysis. Filtered samples were then suspended in 12 mL vials containing 2 mL 10 mol/L NaOH and screw-capped with a silicon-teflon septum. The vials were kept in the dark with rotation at 50 °C for more than 6 h to allow breakdown of DMSPp and its product DMS to be trapped in the headspace. One to three mL of the headspace gas was taken for measurement. Accuracy was tested by analyzing six replicate filtration samples from the same water sample. Relative standard deviation was 5%. Phytoplankton samples for taxonomic examination were preserved with Lugol's solution. Identification and enumeration of net-sized phytoplankton (> 20 µm) were done by microscopy. Water samples (100-500 mL) were filtered (Whatman GF/F) for Chl a analysis. Chl a was determined using a Turner Design Model 10 fluorometer according to the method of Parsons et al (1984). Nitrate, ammonia, and phosphate were analyzed using a Skalar San and Plus Auto-Analyzer following the JGOFS protocols (SCOR,1996). 3 RESULTS 3.1 Distribution of DMS and DMSPp DMSPp concentration showed a remarkable geographic variation with the highest value of 94.12 nmol/L in the coastal water of the JZB and the lowest, 0.45 nmol/L, in the oceanic water of the Kuroshio Current in the ECS (Fig.1). Within the ECS, however, the highest DMSPp values were not in the estuary and coastal waters (e.g. St. 404501), but in the shelf waters (e.g. St. 410-503) and the eddy area (St. 3108). There was an increasing trend from south to north in DMSPp along the Kuroshio Current direction (St. 414/418 → St. 3306 → St. 205 → St. 203 → St. 201) and a decreasing trend from the central shelf water (St. 410) in both inshore and offshore directions along Transect 4. With respect to water depth, DMSPp concentration was in the following order: shelf water > offshore water > coastal water (Table 1). When classified by trophic level, the mesotrophic shelf waters (St. 406 to 411) ranked No.1 in terms of DMSPp concentration, followed by the mesotrophic offshore waters (St. 201 to 205). The eutrophic coastal waters (St. 403, 404) with abundant nutrients (nitrate in the surface water was up to 25 µmol/L) ranked the third in DMSPp concentration, slightly higher than that in oligotrophic oceanic waters (St. 414, 418) where nitrate concentration was less than 0.1 µmol/L (Table 2). (Transect 5 was not counted due to lack of nutrient data). DMS concentration in the study areas also showed remarkable spatial and temporal variations. In the JZB, it ranged from less than 0.5 nmol/L in November 1995 to more than 52.6 nmol/L in August 1995, with an overall average value of 6.0 nmol/L (overall surface average 6.6 nmol/L) during the study period (Table 3). In the ZFB, DMS concentration varied from 1.4 nmol/L in November 1997 to more than 40 nmol/L in May 1997, the overall average of 8.4 nmol/L (overall surface average 8.7 nmol/L) (Table 4).The annual mean level of surface DMS in the aquaculture bay ZFB ((8.71±10.52) nmol/L) was little higher than that in the JZB ((7.58 ± 6.68) nmol/L). The dramatic fluctuations of DMS concentration showed a clear seasonal pattern. In both coastal waters, it was lowest in autumn and highest in either spring or summer. 3.2 Factors affecting DMS and DMSPp levels 3.2.1 Biological factors In general, there was a positive relationship between the concentrations of Chl a and DMS or DMSPp. For instance, the Chl a level in the two bays was higher than that in the ECS. Within the ECS, Chl a was higher in the shelf waters than in the Kuroshio areas. Levels of DMSPp followed the same distribution pattern. Seasonally, DMS and Chl a followed the same trend as in the ZFB (Table 4). There were also similar but weaker trends for DMS, DMSPp and Chl a on an annual cycle at a fixed observation site in the JZB (Fig.3a). Moreover, there was a correlation between DMSPp and Chl a (r2 = 0.368 7) in the ECS (Fig.3b), which became more significant (r2 = 0.605 8) when only the data associated with nitrate level lower than 1 µmol/L were employed (Fig.3c). DMS or DMSPp concentration as a function of Chl a varied temporally (JZB and ZFB, Tables 3, 4) and spatially (ECS, Tables 1, 2). Differences in species composition could be one of the factors responsible for such variations. For instance, in the JZB, although there was no significant correlation between DMS or DMSPp and Chl a for the overall data (Fig.4a), some significant correlations were found between DMS and Chl a when particular species were considered (Fig.4, b, c). It appeared that Chaetoceros compressus and Rhizosolenia fragilissima contributed remarkably to the DMS concentration of the time, while Chaetoceros densus and Pseudo-Nitzschia. pungenswere not (Fig.4, d, e). This can also be seen from the horizontal distribution in March 1997 when there were two most abundant species, C. compressus and C. census prevailing in the northeast and southwest of the bay. Higher DMS concentrations were associated with the abundancy of C. compressus compared with C. densus (Fig.5a). In September1997, R. fragilissima and Skeletonema costatum were the most abundant species in the bay. Higher DMS concentrations were linked to R. fragilissima rather than S. costatum (Fig.5b). In the ZFB May 1997, there was a spring bloom where C. compressus was the most abundant species. During the bloom, DMS and Chl a concentrations reached their peaks of (14.4 ± 12.4) nmol/L (surface mean (14.03 ± 13.12)) and (3.4 ± 2.6) µg/L, respectively (Table 4). There was also aclose correlation between DMS and Chl a in the bloom period (Fig.6a). Furthermore, their horizontal distributions also followed the same pattern (Fig.6, b, c). It can be seen that DMS concentration could be very high during an algal bloom, even though the DMSPp/Chl a ratio was lower than the other seasons (Table 4). 3.2.2 Chemical factors DMS and DMSPp were not found to be related to physical parameters such as temperature or salinity in our study areas (data not shown). Statistical analysis also showed no significant correlation between DMS or DMSPp and total nitrogen, ammonia and phosphate. For nitrate, the major component of nitrogen here, however, we found some interesting relationships with DMSPp. In the ECS, nitrate was not correlated with DMSPp when all data were considered. However, a significant positive correlation between nitrate and DMSPp was observed when nitrate concentration was lower than 1 µmol/L (Fig.7a). Also, there was roughly an inverse trend between the two when nitrate concentration was higher than 1 µmol/L (Fig.7b). There were close correlations between nitrate and Chl a (Fig.7c) and between Chl a and DMSPp (Fig.3c) when nitrate levels were lower than 1 µmol/L. To test the effects of nitrate on cellular DMSPp production, we employed the ratio of DMSPp to Chl a and found a decreasing trend in this ratio with increasing nitrate concentrations for all the data from the ECS. When the data from the estuarine area (St. 403, 404), where nitrogen was very abundant (up to > 25 µmol/L), and those from the rest of the sea were analyzed separately, significant inverse correlations were found between DMSPp/Chl a and nitrate for both groups ( y = 4.33-0.11 x, r2 = 0.698 0 and y = 4.51exp (-0.27 x ), r2 = 0.451 9, respectively. There y is the DMSPp/Chl a and x is the NO3-N). 3.2.3 Anthropogenic factors Some general trends in the distribution of DMS or DMSPp appeared to be associated with human activities. The DMSPp/Chl a ratio in the JZB was far higher than that in the ECS. Although this can, to some extent, be attributed to temporal and species-composition differences, many effects from the land surrounding this semi-closed bay could also play a role in controlling DMSPp production. In the JZB, the harbor areas (St. 6-8; with mean DMS of 10.17 nmol/L, 11.79 nmol/L, 13.92 nmol/L, respectively), aswell as the major sewage outlet of Qingdao City and the aquaculture area (St.3, mean DMS was 7.17 nmol/L) often ranked the first to third in terms of surface DMS concentration among the 10 investigation stations. In contrast, St. 9, situated at the mouth of the JZB and with the deepest water (39 m) and high current velocity, had the lowest DMS levels on almost all occasions. Other stations, including St. 5 at the center of the JZB and St.10 located outside the bay had a high frequency to have moderate DMS concentrations (Fig.8a). A similar situation was observed in the ZFB, where St.1 near the sewage outlet of Yantai City was always ranked No.1 in terms of DMS level (14.38 nmol/L), the aquaculture areas (St. 4, 6 and 9) also associated with high DMS abundance, except for St. 8 which is the nearest to the inlet of the gulf current from offshore (Fig.8b). 4 DISCUSSION 4.1 Distribution pattern There have been two previous studies on DMS distribution in the ECS by Yang et al (1996) and Uzuka et al (1996). Compared with the DMS distribution pattern by Uzuka et al (1996) at their only transect, PN transect, which is almost identical to our Transect 4, the locations of the maximum DMSPp site (St.410) and the lowest DMSPp site (St.414) in the present study were almost identical to those (St.7 and St.4 of PN transect respectively) of DMS concentration in their February cruise 1993 (which is closest to our investigation time). The geographical distribution pattern of DMSPp by present study was partially agreed with that of DMS by Yang et al (1996) in October 1993 and 1994, both DMS and DMSPp concentrations were high in the shelf water, and relative low in the Kuroshio area. But the DMS was lowest in the northeastern sea by Yang et al (1996) where DMSPp was relatively high in this study. This inconsistency could be due to spatial (sampling locations) and temporal differences between the two investigations. Yet, the differences in the nature of dynamics of DMS and DMSPp could be one of the primary reasons. First, biological factors affect both DMSP and DMS pools in two opposite directions: phytoplankton production adds to the DMSPp pool (Vairavamurthy et al, 1985); bacterial and phytoplanktonic DMSPp-lyase cleave DMSPp into DMS decreasing the DMSPp pool and increasing the DMS pool (Laroche et al, 1999); zooplankton grazing accelerates the exudation of DMSPp from phytoplankton cells increasing the production of DMS (Dacey and Wakeham, 1986; Cantin et al, 1996); bacteria can also take up DMS/DMSPp as carbon and sulfur resource reducing the DMS/DMSPp pool (s) (Kiene et al, 2000). Secondly, physical activities such as mixing, volatilization may also cause uncoupling of DMSPp and DMS in the field. Previous studies have shown remarkable spatial and temporal variations in the distribution of DMSPp and DMS (Leck et al, 1990; DiTullio and Smith, 1995). DMS concentrations underwent dramatic seasonal variations in both the JZB and the ZFB, with the lowest levels in November and the highest either in spring or summer. This seasonal pattern was consistent with those of other temperate areas (Leck et al, 1990; Turner et al, 1996). The recorded concentrations in the JZB and the ZFB were within the reported range in non-oceanic waters (Leck et al, 1990; Turner et al, 1996; Uzuka et al, 1996) and higher than those in oceanic waters (Dacey et al, 1998; Jones et al,1998) . 4.2 Factors affecting DMS/DMSPp levels Although DMS and DMSPp are ultimately from algae (mainly phytoplankton, except for some shallow coastal waters where macroalgae might also be important), it is uncommon to obtain a significant correlation between the concentration of DMS or DMSPp and a biomass indicator such as Chl a (Leck et al, 1990; Wolfe et al, 1994; Kwint and Kramer, 1996; Townsend and Keller, 1996; Simó et al, 1997; Kettle et al, 1999) because DMSPp production is spe-cies-specific and DMS production is controlled by extracellular processes involving the entire planktonic community (Simó et al, 1997), such as zooplankton grazing (Leck et al, 1990; Christaki et al, 1996; Wolfe et al, 1997; Jones et al,1998) , microbial activity (Kiene and Bates, 1990; Kiene, 1992; Wolfe et al, 1994; Zimmer-Faust et al, 1996; Jones et al, 1998), and the release of algal lysis upon senescence or cell breakage (Wolfe et al, 1994). We also realized, in the present study, that DMS and DMSPp concentrations can be very uncoupled. There was a big gap between concentrations of DMSPp ((22.0±5.5) nmol/L) and DMS ((0.6± 0.2) nmol/L) in the JZB in November of 1995 (Table 3). In addition to the above reasons raised by previous investigators, the very low concentration of DMS in this study could be due to high rate of volatilization to the atmosphere by strong wind in this season as well as the time lag between DMSPp and DMS peaks (Schultes et al, 2000). Whereas, when species composition was taken into account, significant correlations were found between DMS concentration and Chl a. Nevertheless, the taxa well known to produce high levels of DMS, prymnesiophytes (especially Phaeocystis pouchetii) (DiTullio and Smith, 1995; Stefels et al, 1995; Turner et al, 1995; Kwint and Kramer, 1996) and dinoflagellates (Townsend and Keller, 1996; Jones et al, 1998) were not dominant species in the study areas. On the other hand, the typical coastal diatom taxa were dominating in biomass basin-wide and year-round. The DMS/Chl a ratios in the JZB and the ZFB were lower than that for Phaeocystis pounchetii, which produces high levels of DMS (58-78 nmol/L/µg), and were similar to that of other diatom-dominated environments (2 -12 nmol/L/µg) (DiTullio and Smith, 1995). Although diatoms are usually considered to be poor DMS producers (Keller 1989; Stefels et al, 1995; Jones et al, 1998), there have been a few studies suggesting that the contribution of diatoms to the DMS budget in the water column could not be overlooked (DiTullio and Smith 1995; Levasseur et al, 1996). The significant correlations between DMS and Chl a in the ZFB and the JZB indicated that although diatoms are not rich in terms of cellular DMSPp content, they may play an important role in total DMS production in coastal waters. The DMS/Chl a ratio together with species composition analysis may indicate the source of DMS from different species. In the present study, when diatoms are the main contributors of DMS, as indicated by the significant correlation between DMS and Chl a in samples dominated by a diatom species (Figs.4, b, c, 6), relative low DMS/Chl a ratios were found (Tables 3, 4) being consistent with the results of previous studies (DiTullio and Smith, 1995). On the contrary, in the JZB, May of 1997, when both Chl a and DMS reached their annual peaks (Table 3), and there was no significant correlation between DMS and Chl a (Fig.4d), the relatively high DMS/Chl a ratio compared to other seasons (Table 3) indicates the existence of some potential species that might be low in biomass density but very productive in terms of DMS. High DMS concentration is usually closely linked to the presence of phytoplankton blooms (Turner et al, 1995; Ciglenecki and Cosovic,1996; Kwint and Kramer, 1996) . Even if DMSPp/Chl a ratio is relatively low, total DMS production can be very high due to the huge biomass and the consequences of biological activities like bacterial consumption (Kwint and Kramer,1996; Kiene et al, 2000) and zooplankton grazing (Leck et al, 1990; Wolfe et al, 1997; Jones et al, 1998). The bloom in the ZFB, May of 1997 was such a case: when DMS concentration reached its peak of the year, DMS/Chl a ratio was lower than the other seasons (Table 4). We only identified phytoplankton in the netplanktonsize category. However, in some cases, nanoplankton and even picoplankton may be the major contributors to the total biomass. Physical factors, such as temperature, salinity and water masses have previously been reported to affect DMSPp or DMS production (Baummann et al, 1994; Jones et al, 1998; Simó and Pedros-Alio, 1999). In the ECS, the distribution of DMSPp showed distinct ecological features associated with water masses. Except for the effects of nitrogen on DMSPp production (see below), the unexpectedly high DMSPp concentration in shelf waters rather than in the coastal waters seemed to be controlled ultimately by physical oceanographic factors. For instance, the St. 410, with the highest DMSPp level and the second highest Chl a concentration (average Chl a =1.18 µg/L), has been recognized as a highly productive area (Jiao et al, 1998) that is most likely associated with the interaction of the shelf water and the Kuroshio Current (Fig.9). There is a similar situation at the other site with high DMSPp levels and the highest Chl a (average Chl a = 1.42 µg/L), St.503, where the coastal water interacted with the Taiwan Strait Current and biomass is very high (Xu et al, 1990). The site of lowest DMSPp concentrations with lowest Chl a, St. 414, was associated with oceanic conditions of the Kuroshio Current as seen from the temperature and salinity distribution (Fig. 9). Therefore, it is most likely that DMSPp concentration was controlled by the physical oceanographic conditions of the water masses. The effects of salinity on DMS production have been observed in laboratory experiments (Vairavamurthy et al, 1985) but not always in the field (Iverson et al, 1989). We previously showed pronounced influences of salinity on production of DMSPp of some common coastal species, Tetraselmis spp., Dunaliella spp . and Chaetoceros muelleri, in cultures (Li and Jiao, 1999). However, no significant correlation between DMS or DMSPp and salinity was recorded in the field of the present study areas. In contrast, nitrate seemed to be a factor associated with DMSPp production, which has been suggested to affect DMSPp production because DMSPp can be substituted by glycine betaine as an osmoregulatory substance when nitrate is relatively abundant (Turner et al, 1988; Gröne and Kirst, 1992; Kiene and Gerard, 1995) though uncertainties still remain (Keller et al, 1999). Our field data showed two-phased relationships between nitrate availability and DMSPp: positive when nitrate is inadequate (as limiting nutrient) and negative when nitrate is abundant. In the case of the ECS, the threshold of nitrate concentration between the two states was around 1 µmol/L at the study time. Although there could be time lag between nitrate availability and DMSPp abundance in the field, the two-phased relationship was distinct across the large geographical scale and large nutrient gradient. Anthropogenic eutrophication has been suggested to enhance DMS production (Berg et al, 1996). Although it is difficult to obtain any definite relationship between human activities and DMS production, we frequently found high DMS concentrations in the sewage outlets, harbor areas and aquaculture areas. Since the sea has been proven to be an important source of DMS emission to the atmosphere, anthropogenic eutrophication in the coastal area may result in increase of sulfur flux to the air from the sea. ACKNOWLEDGEMENTS We thank Prof. WU Yu-Lin and Prof. SHEN Zhi-Liang for their assistance in phytoplankton taxonomic examination and nutrient determination. REFERENCES
(Managing editor: HAN Ya-Qin) Copyright 2003 - Acta Botanica Sinica. Free, full-text also available from http://www.chineseplantscience.com The following images related to this document are available:Photo images[as03005f7.jpg] [as03005f2.jpg] [as03005f8.jpg] [as03005t2.jpg] [as03005f4.jpg] [as03005f5.jpg] [as03005t3.jpg] [as03005f6.jpg] [as03005t1.jpg] [as03005f1.jpg] [as03005t4.jpg] [as03005f3.jpg] [as03005f9.jpg] |
| |||||||||