 |
| About Bioline | All Journals | Testimonials | Membership | News |
|
||||||
|
||||||
Acta Botanica Sinica, Vol. 45, No. 7, 2003, pp. 787-794 Genetic Structure of Reaumuria soongorica Population in Fukang Desert, Xinjiang and Its Relationship with Ecological Factors XU Li1, WANG Yi-Ling1, WANG Xu-Mei1, ZHANG Lin-Jing1, YUE Ming1, GU Feng-Xue2,
PAN Xiao-Ling2, ZHAO Gui-Fang1* (1. School of Life Sciences, Biodiversity Research Center of Qinling Mountains, Northwest University,
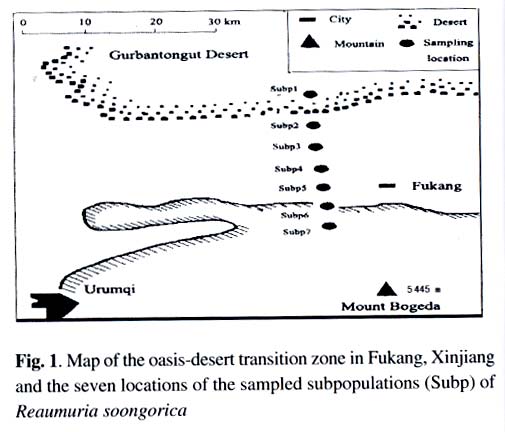
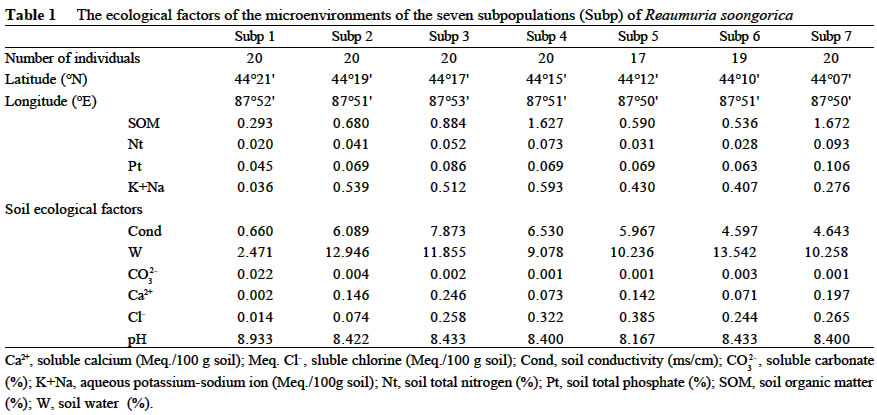
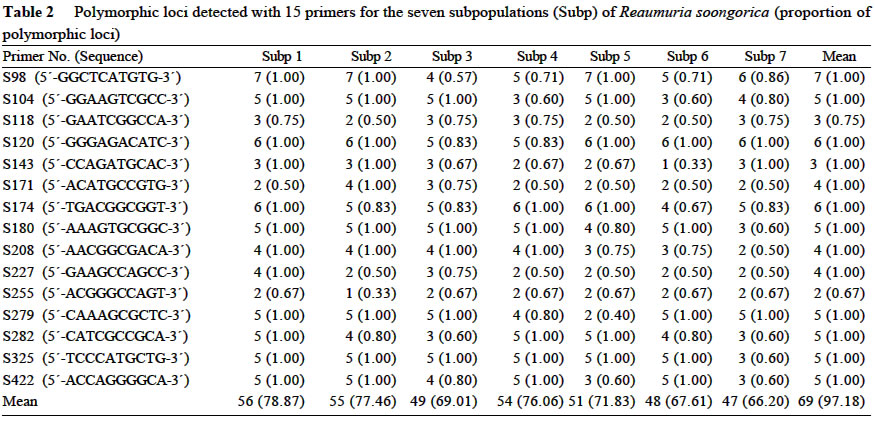
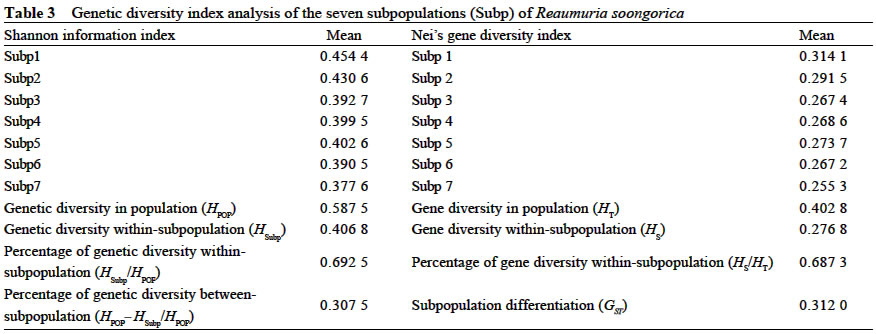
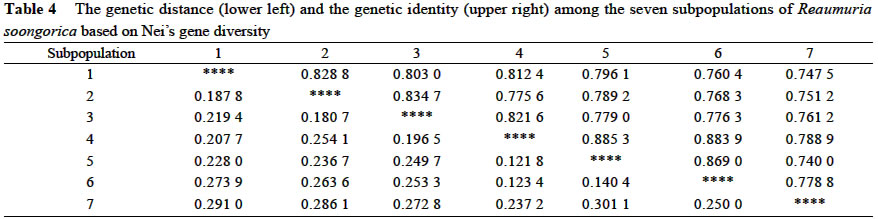
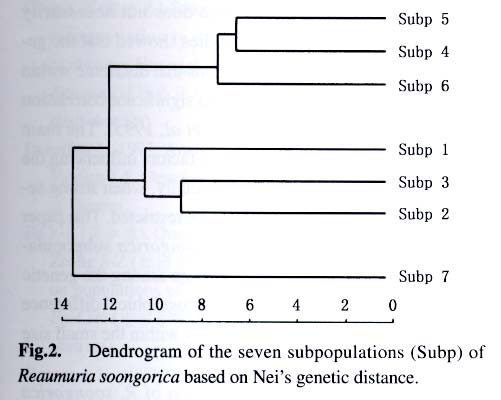
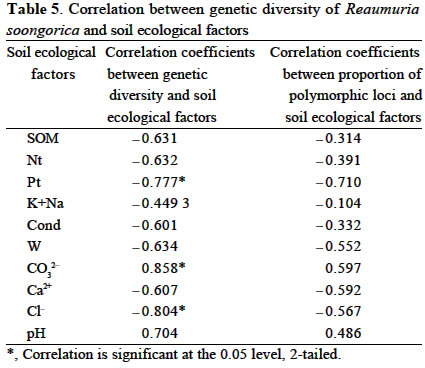
Xi'an 710069, China; Received: 2002-07-23 Accepted: 2003-01-17 Code Number: as03006 ABSTRACT Genetic structure and differentiation of Reaumuria soongorica (Pall.) Maxim population from the desert of Fukang, Xinjiang, were assessed by means of random amplified polymorphic DNA (RAPD) markers. High genetic diversity and differentiation were revealed in the population of R. soongorica by 15 random primers. One hundred and thirty-six individuals from seven subpopulations were sampled in the study. Seventy-one loci have been detected, and among them 69 were polymorphic. The mean proportion of polymorphic loci (PPB) was 97.18%. The analyses of Shannon information index (0.307 5), Nei's gene diversity (0.312 7) and GST (0.312 0) indicated that there were more genetic variations within the subpopulations than those among the subpopulations. The results of AMOVA analysis showed that 61.58% of the genetic variations existed within subpopulations, and 38.02% among the subpopulations. The gene flow among the subpopulations of R. soongorica (Nm = 1.102 8) was much less than that of the common anemophytes (Nm = 5.24), so genetic differentiation among the subpopulations occurred to some extent. Additionally, through the use of clustering and the correlation analyses, we found that the genetic structure of natural population of R. soongorica was related to some ecological factors (soil factors mainly) of the oasis-desert transition zone. The genetic diversitylevel of R. soongorica had negative correlation with the content of total soil P and Cl significantly (P < 0.05). On the contrary, it had significant positive correlation with CO32- (P < 0.05), showing that the distribution of the individuals of R. soongorica in the sampled areas correlates with certain soluble salt. Furthermore, the genetic diversity of the natural population of R. soongorica increased with the decreasing of the content of soil organic matters, water, total N and total P in soil. The paper concluded that the microenvironment ecological factors played an important role in the adaptive evolution of R. soongorica population. Key words: Reaumuria soongorica ; genetic structure; ecological factors; desert plant Many hypotheses about the maintenance of genetic diversity have been discussed extensively in the recent years (Bayer, 1992). Ecological factors such as soil, geography, climate, etc., play important roles in the genetic differentiation of plant populations, especially for the cosmopolite species. Although it is not certain if the ecological factors are the fundamental reasons in maintaining the genetic differences among subpopulations, researches have shown correlations between ecological factors and variation of some loci (Nevo, 1988; Chen and Song, 1997). Reaumuria soongorica, an extreme xeric semishrub of Tamaricaceae, is the constructive and dominant species of the desert grasslands in China (Ma and Kong, 1998). R. soongorica desert is a typical zonal vegetation in the Central Asia, which is distributed from the western Erdos, Alashan, Hexi Corridor, Beishan, Qaidam Basin, Gashun Gobi to Tarim Basin and Junggar Basin in China (from the east to the west), and forms the vast and distinctive landscape of the salt desert (Liu and Liu, 1996). Moreover, R. soongorica contains abundant nutrient substances so it becomes an important local forage plant. Previous studies on R. soongorica focused on the aspects of morphology, physiology and ecology. No DNA-based studies on R. soongorica have been yet performed. A study on the genetic diversity of R. soongorica in the oasis-desert transition zone is prerequisite to reveal the ecological and genetic consequence and to preserve the biodiversity, and to maintain the stability of the oasis-desert ecosystem. The specific objective of present study is, by using RAPD technology, to detect the DNA polymorphism in the R. soongorica population, a typical desert plant growing in an oasis-desert transition zone of microenvironments in Fukang, Xinjiang, China, and to analyze the consequence of the ecological factors on the genetic diversity of the population. The results of the survey could provide some molecular information to understand the genetic background and evolution of R. soongorica, and further help to plan an effective conservation strategy for the species. 1 MATERIALS AND METHODS 1.1 Field sampling The region investigated, ranged over 44°08' -44°21' N and 87°50' -87°54' E, is located at the north foot of the Mount Bogeda, the highest peak of the East Taishan Mountains, and on the south fringe of the Gurbantongut Desert. It is a transition zone between Fukang oasis and the desert. Oasis and desert are conceptually two opposite extremes, but to some extent, they can transform to each other. The transition zone is the region where the transforming activities occur violently and conspicuously. Reaumuria soongorica (Pall.) Maxim is the constructive and dominant species in the zone, which is mostly distributed in the pluvial fan and the alluvial plain in front of the mountains. The topography of the region is higher in the southeast and lower in the northwest. Generally, the soil in the habitat of R. soongorica is the grey-brown desert soil, but the plants also can grow healthily in the grey desert soil and in the salted, or even strongly salted soil. In the study, seven sampling locations, each of which was regarded as one subpopulation, were established from north to south of the western part in Fukang Desert Ecosystem Observation and Experiment Station, The Chinese Academy of Sciences in July 2000 (Fig. 1). Each subpopulation, about 3 km apart from each other, was sampled, along a 40-km oasis-desert transition zone, to represent the different ecological conditions of soil, latitude, and longitude. The details of the ecological factors of the microenvironments of the seven R. soongorica subpopulations are shown in Table 1. Healthy individuals of R. soongorica were selected randomly and from each individual fresh leaves were collected and dried with silica gels. Because the species has strong rhizome propagation capacity, the distance among the individuals sampled in the same subpopulation was kept more than 10 m to avoid sampling a clone. The dried leaf samples were stored at -80 °C until DNA extractions were carried out. 1.2 DNA extraction and primers selection Genomic DNA was extracted from the dried leaves using the modified 2 × CTAB protocol (Wang and Fang, 1998). DNA obtained was dissolved in 0.1 × TE solution at the concentration of about 10 ng/µL and preserved at -20 °C for PCR. In order to obtain reliable and reproducible data, 15 primers were selected for the experiment by screening 100 random primers of 10-mer oligonucleotide (obtained from Shanghai Sangon Company). Sequences of the primers used in the experiment are listed in Table 2. 1.3 PCR amplification and data analysis PCR amplifications were carried out in 20 µL volume containing 2 µL of 10×reaction buffer; 1.5 µL MgCl2 (25 mmol/L); 0.4 µL dNTP, dATP, dTTP, dGTP, dCTP, 10 mmol/L each); 2 µL of template DNA (10 ng/µL); 8 µL primer (0.7 µmol/L); 0.4 µL Taq DNA polymerase (5 U/µL, Shang-hai Sangon) and 5.7 µL ddH2O. The reaction mixtures were overlaid with 20 µL mineral oil. The amplifications were performed on a DNA TGradient thermocycler (Biometra®, Whatman), with the following cycling conditions: initial 5 min 30 s at 96 °C; 40 cycles of each 1 min 30 s 94 °C, 1 min 40 °C, 2 min 72 °C; and a final extension of 10 min at 72 °C, then paused at 4 °C. Amplified products were analyzed with electrophoresis (TAE electrophoresis) on 1.4% agarose gel stained with ethidum bromide, and the gel images were analyzed with the Kodak Scientific Imaging Systems. RAPD bands were scored as binary presence (1) or absence (0) characters, to assemble the matrix of the RAPD phenotypes. Genetic diversity was measured by the percentage of polymorphic bands (PPB), Shannon information index (Lewontin, 1972), Nei's gene diversity (Nei, 1973), the genetic distances between the subpopulations, the value of gene flow (Nm) and subpopulation differentiation ST ) by using POPGENE (Yeh and Yang, 1999); With AMOVA (Excoffier, 1995) we calculated variance components, which partitioned among individuals within subpopulations, among subpopulations within the region; A dendrogram demonstrating the relationships among the seven R. soongorica subpopulations based on Nei's genetic distance was established according to the unweighted pair-group method with arithmetic averages (UPGMA); By using SPSS 10.0, the correlations between the genetic diversity within subpopulations and the soil factors, and between the genetic distances and geographic distance among the subpopulations were conducted. 2 RESULTS 2.1 Analysis of RAPD profiles RAPD markers were generated by 15 primers for 136 individuals sampled from seven subpopulations of R. soongorica. In total, 71 loci were detected, of which 69 were polymorphic. The mean proportion of polymorphic loci (PPB) of R. soongorica is 97.18% at population level (Table 2). According to the PPB, the amount of genetic variation among the 7 subpopulations (Subp) was as Subp 7 < Subp 6 < Subp 3 < Subp 5 < Subp 4 < Subp 2 < Subp 1 (from low to high). 2.2 Genetic diversity of R. soongorica and its partition The Shannon information index varied among the subpopulations as Subp 7 < Subp 6 < Subp 3 < Subp 4 < Subp 5 < Subp 2 < Subp 1, which differed slightly from the results of PPB. The largest difference was between the subpopulation 1 and subpopulation 7 (Table 3). Shannon information index was also used to partition the diversity into within-and between-subpopulation components. In this study, it was found that most of the diversity (69.25%) occurred within subpopulations, only 30.75% occurred between subpopulations. Nei's gene diversity index in population (HT) was 0.402 8 and was 0.276 8 within subpopulations (HS), and GST of this species was 0.312 0 (Table 3). At the level of subpopulation, the gene diversity of Subp 7 was the lowest (0.255 3) while Subp 1 was the highest (0.314 1), which was in accordance with the results measured by Shannon information index. The analysis by AMOVA implied that the genetic variation within subpopulations (VB= 8.500 7, 61.58%) was higher than that among subpopulations (VA= 5.215 3, 38.02%), which is congruent with the Nei's gene diversity index. Table 4 shows the genetic distance and genetic identity among the subpopulations. The variation of the genetic distance ranged from 0.121 8 (between Subp 4 and Subp 5) to 0.301 1 (between Subp 5 and Subp 7). The mean distance was 0.227 4. The analysis of the genetic identity among the subpopulations of R. soongorica indicated that the largest genetic identity occurred between Subp 4 and Subp 5 (0.885 3) and the least occurred between Subp 5 and Subp 7 (0.740 0). Based on Nei's genetic distance, clustering analysis was used to generate a dendrogram of the subpopulations (Fig. 2). The dendrogram demonstrated that the seven subpopulations were divided into three main groups: group I included three subpopulations (Subp 4-6), in which Subp 4 and 5 were clustered firstly; groupII also contained three subpopulations (Subp1-3), in which Subp 2 and three grouped before they clustered with Subp1; and group III had only Subp 7. 2.3 Analysis of correlation between genetic diversity and ecological factors The results of the correlation analysis (Table 5) indicated that Shannon diversity index of the seven subpopulations had significant negative correlation with the content of soil total P, and Cl-, but had significant positive correlation with CO32-(P < 0.05). There was no significant correlation between the genetic diversity and the other soil factors (P > 0.05). The content of Cl-in soil of the transition zone increased from the north to the south, but the distribution of CO32-in the soil was the reverse, which implied that the distribution of the individuals of R. soongorica correlated with some soluble salinity. Furthermore, the study indicated that the genetic diversity of the natural population of R. soongorica increased with the decreasing of the content of organic matters, water, total N and P in the soil. This negative correlation implied that R. soongorica had potential reservoir of genetic diversity to adapt harsh environment in its long-term evolution. There was no significant correlation between the genetic distance and the geographical difference in latitude and longitude respectively among the seven subpopulations of R. soongorica (P > 0.05), which is in accordance with the result from the study on wild soybeans (Fu et al, 2002). DISCUSSION 3.1 Genetic diversity of R. soongorica in the oasis-desert transition zone in Fukang R. soongorica is a salt-secreting halophyte that has strong tolerance to salt and drought. Liu et al (1982) reported that among several mesophyte, xerophyte, psammophyte and extreme xerophyte investigated, R. soongorica was a dwarf and deep-rooting plant and had fleshy leaves with extremely thick cuticle, few hollow stomata, very small surface area, and well-developed wa-ter-storing tissues. It had also the lowest water potential, and the highest ratio of bound water/free water, suggesting that it had strong water-holding power. Meanwhile, its transpiration intensity was the least. Besides these morphological and physiological characteristics, we found that R. soongorica has the unique characteristics on the genetic structure to adapt the harsh environment. Genetic diversity is the result of long-term evolution and represents the evolutionary potential of a species. Surviving in harsh environment, a species has to evolve and accumulate more genetic variations to adapt variable ambient pressure (Li et al, 1999), which has proved to some extent that the higher level of genetic diversity exists in the R. soongorica population and, in particular, there are more molecular variation within subpopulations. The genetic character of R. soongorica relates to the effective size of subpopulations, the breeding system, the pollination mechanisms and the life history characters. R. soongoricais a macrobiotic perennial plant, which has strong rhizomatic reproductive capacity. The stem of the species is able to split to continue its particular asexual propagation, especially in bad climatic conditions (Liu et al, 1982). Meanwhile, R. soongorica conducts sexual propagation by anemogamy. The characteristics of the cosmopolitan distribution and anemogamy of the species contribute to the high genetic variation in its subpopulations (Hamrick et al, 1979). Meanwhile once seeds germinate into seedlings and settle down, the asexual propagation can quickly fix the high genetic diversity of the subpopulations (Korpelainen and Kolkkala, 1996). The genetic differentiation of a natural population is regarded as a kinetic process of the balanced relationship between gene flow and selection. Generally, the extent of the genetic differentiation within a population of plant reaches 1%-12% (Chen and Song, 1998). Anemophilous and crossbreeding species usually have lower genetic differentiation than inbreeding species. Under given conditions, significant genetic difference occurs in short distance. Liu et al (1983) summarized that the intensive selection was the reason for the remarkable genetic difference produced within several meters, which implied that intensive selection could lead to the genetic differentiation within short distance in spite of great gene flow. The individuals of R. soongorica subpopulations living in the oa-sis-desert transition zone endure the comprehensive selection from various ecological factors of the natural environment, therefore, the higher genetic differentiation and variation lies in the subpopulations. Merrell (1981) considered if there were the similar gene frequency in the neighboring populations, it possibly showed that they were suffering the same selection but did not prove the existence of gene flow. Ordinarily, when Nm > 1, gene flow can resist the genetic drift in the population and prevent the differentiation among them (Slatkin, 1985). However, the gene flow was much less than that of the common anemophytes (Nm = 5.24) (Hamrick et al, 1995), so the species was in the critical state of genetic differentiation to some extent. Furthermore, the human activities including grazing and cutting influence the genetic diversity of plants profoundly. 3.2 Genetic diversity of R. soongorica and ecological factors in its microenvironments The information from the allelic data such as the RAPD analysis is the main resource for population genetic studies and provides lines of evidence to discuss genetic structure and variation in plant populations. All the ecological characteristics of organisms are the result of the interaction between the genetic substances-DNAs and the external organic or inorganic factors in their environments, which is the comprehensive exhibition of the interaction between the genomes and the complicated environments. Therefore, with regard to the whole ecosystem, the genome ought to be considered as the important and critical factor in the ecological research (Li and Peng, 2001). In our study, the differences of the microenvironments of the subpopulations, from the oasis to the desert, are mainly exhibited by the difference of soil water, soil nutrition, soil salinity and so on, which means that the distribution of R. soongorica subpopulations in the transition zone possibly relates to some soil factors. The genetic diversity index of R. soongorica showed significant positive correlation with CO32-and negative correlation with Cl-, which implies that with the increasing of the content of water-soluble carbonates, the level of the genetic diversity of R. soongorica rises; and when the content of soluble Cl-goes up, the genetic diversity comes down contrarily. That is to say, the soluble salts play an important role in influencing the genetic diversity in the subpopulations of R. soongorica. As the content of salt changes, under the selection pressure, the genetic diversity alters steadily in order to keep the stability of the subpopulations and the well-balanced cycles of substance flow and energy flow. There are different opinions about the relationship between the soil nutrition and the diversity (Gentry, 1988; Bai et al, 2000; Li et al, 2000). This study shows that the genetic diversity correlates significantly and negatively with the soil organic matters, the total N and P: the less soil nutrition, the higher genetic diversity level in the subpopulations. So it is interpreted that the population of R. soongorica has higher genetic diversity because the individuals are inclined to make use of the limited nutrition in soil completely. The geographic isolation affects the differentiation in population significantly. For some plants, the genetic distance correlates with the geographical distance (Schnabel and Hamrick, 1990; Alpert et al, 1993). However, geographical distance does not necessarily cause genetic differentiation. Studies showed that the genetic distance among the populations that distribute within short geographical isolation, has no significant correlation with its geographical distance (Li et al, 1995). The main reason was that there were different factors influencing the differentiation in populations, especially, when strong selection exists, the gene flow would be restricted. This paper demonstrates that among the R. soongorica subpopulations there is no significant correlation among the genetic distance, genetic diversity and the geographical difference on latitude and longitude respectively within the small size of the oasis-desert transition zone. Although in the desert vegetation of R. soongorica plants grow sparsely and there are only small number of species and lower biomass comparatively, R. soongorica still maintains the fragile desert ecosystem, keeps the vital process of the transport of energy and substances, and prevents from wind erosion, drift sands and the further desertification. Therefore, according to the geographical location and the natural condition of the oasis-desert transition zone in Fukang, the assignment test ought to be established in this special region to study the relationship between the desert and the grazing, and between the protection of the biodiversity and the maintaining of the stability of the ecosystem, which provides information for scientifially utilizing and improving the desert steppe. ACKNOWLEDGEMENTS The authors wish to thank Dr. YUAN Yong-Ming at University of Neuchatel, Switzerland, for his critical reading and comments on the manuscript. REFERENCES
(Managing editor: HAN Ya-Qin) Copyright 2003 - Acta Botanica Sinica. Free, full-text also available from http://www.chineseplantscience.com The following images related to this document are available:Photo images[as03006t3.jpg] [as03006t4.jpg] [as03006t2.jpg] [as03006f1.jpg] [as03006t5.jpg] [as03006f2.jpg] [as03006t1.jpg] |
| |||||||||