 |
| About Bioline | All Journals | Testimonials | Membership | News |
|
||||||
|
||||||
Journal of Health, Population and Nutrition, Vol. 23, No. 1, March, 2005, pp. 34-43 Relationship among Fatness, Blood Lipids, and Insulin Resistance in Pakistani Children Abdul Basit1; Rubina Hakeem2; M. Zafar Iqbal Hydrie1; M. Yakoob Ahmedani1; Qamar Masood1; 1Baqai Institute of Diabetology
and Endocrinology and Baqai Medical University, and 2Baqai Institute of
Diabetology & Endocrinology and R.L.A.K. Government College of Home
Economics Karachi, Pakistan
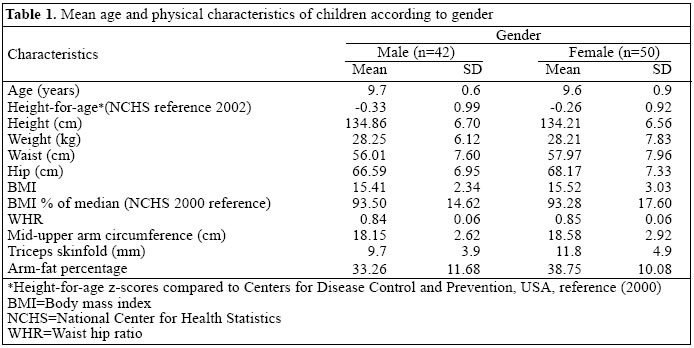
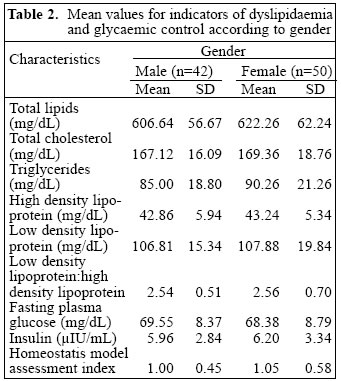
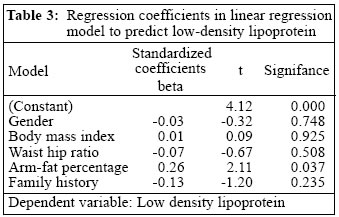
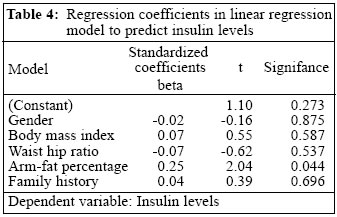
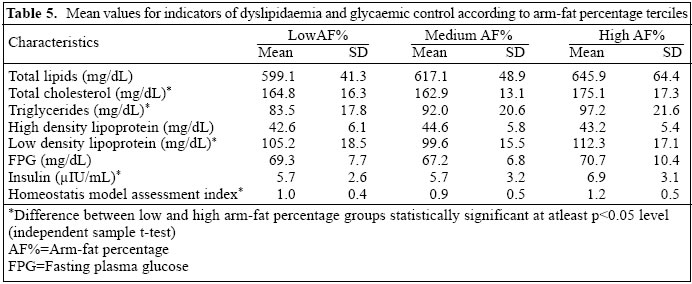
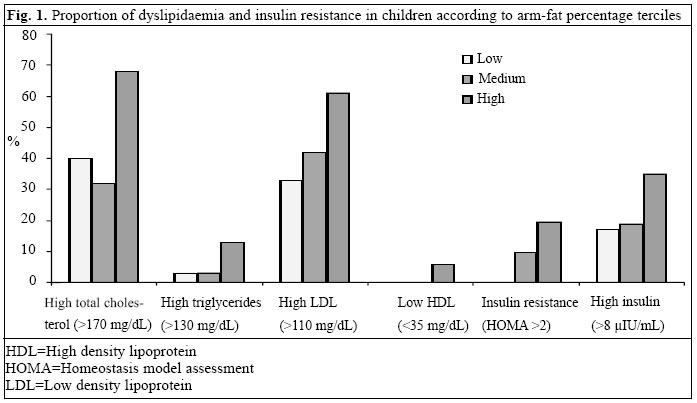
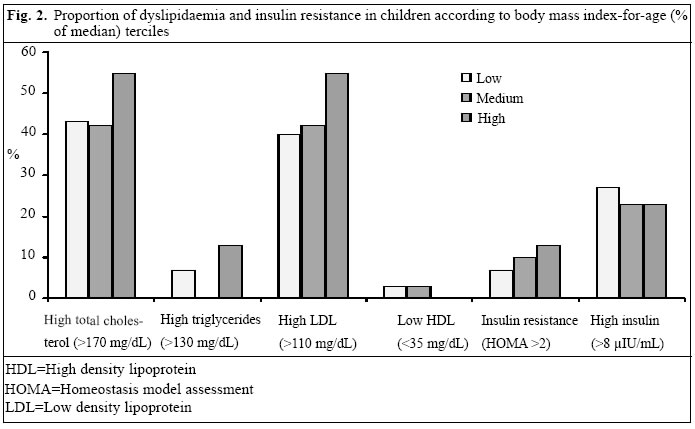
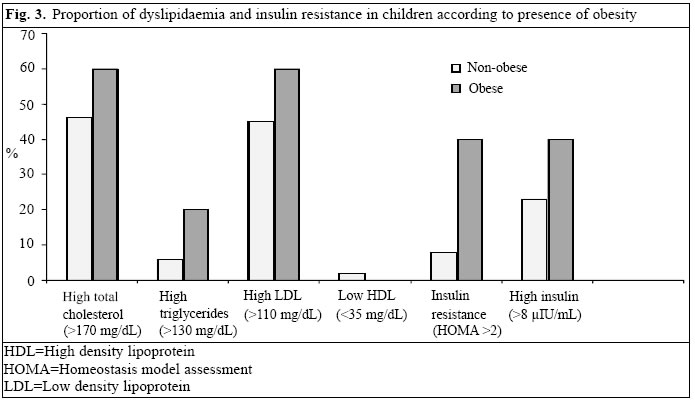
Code Number: hn05005 ABSTRACT Observations on associations between fatness and metabolic risks among South-East Asian adults have resulted in devising lower thresholds of body mass index (BMI) for them. Metabolic abnormalities, including type 2 diabetes, are now also appearing in children and are associated with obesity. There has not been much work done to identify indicators of metabolic risks among South Asian children. This study was undertaken to observe the relationship among fatness, blood lipids, and insulin resistance in Pakistani children. Fatness, lipids, and insulin resistance were assessed in 92 middle-class Pakistani school children aged 8-10 years. Height, weight, waist, hips, mid-arm circumference, and triceps skin-fold, measured in school, were used for calculating various indicators of fatness, i.e. BMI, waist hip ratio (WHR), and arm-fat percentage. Fasting blood samples were analyzed for total lipids, triglycerides (TG), total cholesterol (TC), high density lipoprotein (HDL), low density lipoprotein (LDL), glucose and insulin levels. Homeostasis model assessment (HOMA) index was calculated to assess insulin resistance. Two separate multiple regression models of various risk indicators (family history, sex, BMI, WHR, arm-fat percentage) showed that only arm-fat percentage had a significant positive association both with insulin levels (b=2.04, p= 0.044) andLDL (b= 2.11, p= 0.037). Only five children were overweight(BMI-for-age>85th percentile according to National Center for Health Statistics 2000 reference). Neither overweight children nor those who were in the uppermost tercile of BMI-for-age differed significantly from other children in terms of presence of higher-than-desirable values of lipids or insulin. However, compared to those in the lowest tercile, children who were in the uppermost tercile of arm-fat percentage had a significantly higher frequency of high blood cholesterol (40% vs 67%, p=0.027), high LDL (33.3% vs 61.3%, p=0.026), and markedly higher proportion above average insulin levels (16.7% vs 35.5%, p=0.083). Arm-fat percentage could be developed as a practical tool for determining the risk status of children. However, further cross-sectional assessments are needed to ascertain accurate relationships among arm-fat percentage, lipid profiles, and insulin resistance in larger and varied groups of children. Key words: Obesity; Lipids; Insulin resistance; Anthropometry; Child; HOMA; Pakistan Introduction Syndrome X, or the syndrome of insulin resistance, is a cluster of related metabolic abnormalities of hyperinsulinaemia, glucose intolerance, increased low density lipoprotein (LDL), decreased high density lipoprotein (HDL), and hypertension, and plays an important role in the genesis of cardiovascular diseases (1-5). In several studies, even children from high-risk populations show a higher prevalence of these abnormalities than those from low-risk populations (6-11). Recently, type 2 diabetes has also been observed in children and adolescents in several countries (10,12-15). Fatness, dyslipidaemia, hypertension, and insulin resistance were found to cluster in children (8,16-26), which can be traced into adulthood and predict the occurrence of related disorders in adulthood (27). Positive results from early interventions have been reported (28), and intensive treatment has been shown to produce significant weight loss, improved serum lipid profiles, and reduced hyperinsulinaemia (29). These changes, if sustained, may reduce the risk of developing diabetes later in life. Rates of diabetes and coronary heart disease are now increasing in the developing world, including Pakistan, and children and adolescents could also be at a high risk of developing these disorders (30-33). Therefore, there is a need to study the prevalence of indicators of metabolic risks among South Asian children. Lower thresholds of BMI for South Asian adults have been suggested following observations of associations between fatness and metabolic risks among South Asian adults (34). One may assume that internationally-recommended screening strategies should be adjusted for South Asian children too. Assessment of associations between anthropometric characteristics and risk status of South Asian children and, thus, exploring predictors of risk could help plan screening and intervention strategies. This study was, therefore, undertaken to assess the value of anthropometric measures of fatness to predict children having a higher risk of developing metabolic abnormalities. Materials and Methods Subjects Data were collected from 92 school children, aged 8-10 years, in Karachi, Pakistan, from October to November 2001. To control the effect of sociodemographic variables, four neighbouring middle-income level schools were contacted. After getting approval from school head teachers, class teachers of the particular age-group children (8-10 years old) were contacted to ensure their presence during the study procedure. The purpose and procedure of the study were explained to them, and letters for parents along with a short questionnaire and consent form were given. The questionnaire contained questions about general characteristics of the family, diet and exercise history. After getting informed consent from parents, dates for data collection were decided and conveyed to the parents. Ethical approval for the study was obtained from the departmental ethical review board before starting the study. Data collection Anthropometric measurements A team of medical professionals from the Baqai Institute of Diabetology and Endocrinology (BIDE) took anthropometric measurements (height, weight, skinfold thickness, waist, and hip circumference) and blood samples in schools. A portable stadiometer was used for measuring height following the standard WHO procedures (35). A portable weighing scale was used for measuring weights of all the subjects without shoes, in a single layer of indoor clothing. Using a Holtain skinfold caliper (35), a trained observer measured triceps skinfold until there were two exactly similar consecutive readings from each subject. Mid-arm circumference was measured by holding a measuring tape around the mid-arm between the shoulder and elbow. Waist circumference was measured by holding the non-stretchable measuring tape snugly around the waist at the midpoint between the bottom rib and the tip of the hipbones, and hip circumference was measured at the fullest part of the hips. Anthropometric measurements were used for calculating BMI, waist-hip ratio (WHR) and arm-fat percen-tage. BMI of each child was compared with the National Center for Health Statistics (NCHS)-2000 reference value for corresponding age (in months) to calculate the percentile of median (26). Those having BMI above the 85th percentile were regarded as overweight. Arm-fat percentage was calculated based on the following formula suggested by Rolland et al. (37); this newer formula has closer correlation with fat percentage assessed by magnetic resonance imaging (37):` Total upper arm area (TUA)=C2/4p; (C=Mid-upper arm circumference) Upper arm-fat area estimate (UFE)=Cx(TS/2); TS=Triceps skinfold thickness) Upper arm muscle area estimate (UME)=Cx(TS/2) Percentage of fat in upper arm=(UFE/TUA)x100 Blood test The subjects were asked if they had eaten or drunk any-thing that morning, and the fasting status-confirmation sheet signed by the parents was collected before the blood sample was taken. Blood samples, taken in schools by the laboratory staff of BIDE, were transported to the laboratory for analysis within 30 minutes in appropriate containers (sodium fluoride tubes for glucose, other samples in plain test tubes for serum analysis). A doctor and a schoolteacher were present during the entire procedure. Breakfast was provided to all the children after blood was drawn. Fasting blood samples were analyzed for glucose, insulin levels, and lipid profiles (total lipids, cholesterol, triglycerides, LDL, and HDL). Venous plasma glucose was estimated by the GOD-PAP method (38). Total cholesterol and HDL was estimated by the CHOD-PAP method, while triglycerides were estimated by the GPO-PAP method and LDL value was calculated (39). Insulin was assessed by the DSL-10-1600 ACTIVE insulin enzyme-linked immuno-sorbent (ELISA) method (40). For assessing insulin sensitivity, degree of insulin resistance was assessed by homeostasis model assessment (HOMA) index. Other researchers also have used this index for assessing insulin resistance in children (8,41,42). HOMA index was calculated according to the following formula: HOMA index=Fasting insulin (µIU/mL)* fasting plasma glucose (FPG) (mmol/L)/22.5 Based on various recommendations, children having higher-than-desirable values for cholesterol, LDL cholesterol, and HDL cholesterol were identified (43). For insulin levels, an arbitraryvalue(>8 µIU/mL) was selected to categorize children into two groups. Data entry and analysis Data were entered and analyzed on SPSS 7.5. Predict-ors for blood insulin and LDL were identified by multiple linear regression analysis. Statistical significance of differences in mean values of two groups was estimated by an 'independent samples t-test'. Significance of differences in categorical variables was assessed by chi-square test. Results Ninety-two children (42 males, 50 females), aged 8-10 years with a mean age of boys and girls of 9.6 and 9.7 years respectively, were studied (Table 1). Boys and girls were comparable in terms of height, weight, WHR, and BMI characteristics, and none of the differences were statistically significant. They, however, showed significant differences in skinfold thickness (p=0.029) and arm-fat percentage (p=0.017). These differences are expected due to natural variation in fat percentage of males and females. The average height of children was slightly below the international reference for corresponding age and sex. Height-for-age Z (HAZ) scores were calculated based on international reference indicating degree of variation from the reference group. A score of 0 indicated 100% similarity with negative and positive scores signifying lower and higher-than-reference values respectively. The mean HAZ of the studied group was -0.33 for girls and -0.26 for boys. Only 2% of children (one boy and one girl) werestunted(HAZ<-0.2). In terms of BMI, 83% of children were in the normal range. The average BMI was only slightly below (93% of median value) the international reference for the corresponding age group. Hundred percent of the median reference value indicates exact similarity with the reference population and values below and above 100 signifies lower and higher than average values. Eighty-three percent of children had normal weight (BMI-for-age, between 3rd and 95th percentile), 12% were under-weight (BMI-for-age, less than 3rd percentile), and 5% were obese (BMI-for-age, more than 95th percentile). Only one male and two females had skinfold-thickness measurements more than 95th percentile of reference values for corresponding age (44). The mean values for blood lipids, glucose, insulin levels, and HOMA are given in Table 2. Most mean values were slightly higher for females but none of them attained statistical significance. The mean values for cholesterol and LDL of both boys and girls (boys TC:167.12 and LDL:106.81, girls TC:169.36 and LDL: 107.88) were only slightly below the upper limit of desirable values (170 mg/dL and 110 mg/dL respectively) for children. A large proportion of children had total cholesterol (47%) and LDL (46%) above the desirable limit. Although the mean values for FPG and HOMA were within the normal limits, 10% of children had higher than 2 HOMA index, and 24% had more than 8 µIU/mL values for insulin. Predictors of blood lipids and insulin levels in children To study the relative impact of various factors in deter-mining blood lipid levels or insulin sensitivity, multiple regression analysis was performed. Effects on blood lipids were assessed through a model created using LDL as a dependent variable and gender, family history, WHR, BMI, arm-fat area %, and insulin levels as predictors. The model as a whole did not predict LDL levels (adjusted R2=0.032) but within the model, only arm-fat percentage had significant effect on LDL (t=2.11 and p=0.037). Details of the model are presented in Table 3. To assess the effects on insulin resistance, another model was created using insulin as a dependent variable and gender, family history, WHR, BMI, arm-fat area percentage, and LDL as predictors. The model as a whole did not predict insulin levels (adjusted R2=0.021) but among the predictors, only arm-fat percentage had significant effect on insulin (t=2.04 and p=0.044). Details of the model are presented in Table 4. Differences in mean values for blood lipids and insulin resistance according to fatness of children Currently, there are no international standard cut-off values for arm-fat percentage for children. They were ranked according to terciles of arm-fat percentage; the first group having low arm-fat percentage (mean 25.1; SD 3.8), the second group medium (mean 34.2; SD 2.2), and the third group having high arm-fat percentage (mean 49.1; SD 7.6). The differences in mean values for FPG, blood lipids, insulin, and HOMA were com-pared (Table 5). Children who were in the uppermost tercile of arm-fat percentage had significantly higher TC (175 mg/dL), TG (97 mg/dL), LDL-C (112 mg/dL), LDL:HDL (2.6), insulin (6.9 mIU/mL), and insulin resistance (mean HOMA=1.2) than those in the lowest tercile (p at least <0.05 in each case). Differences in presence of higher-than-desirable values of lipids, HOMA, and insulin according to fatness of children Various forms of dyslipidaemias (higher than recommended desirable values) and insulin resistance (HOMA index >2) were present in a much higher proportion among children in the uppermost tercile of arm-fat percentage (Fig. 1). The difference between group one and three reached statistical significance for TC (p=0.027), LDL (0.026), and insulin resistance (p=0.013). None of the children from the lowest tercile, 3 (9.7%) from the middle tercile, and 6 (19.7%) from the upper tercile had insulin resistance. When children were grouped into terciles according to BMI-for-age, the differences in proportion of children having various biochemical risks were less marked and statistically non-significant (Fig. 2). When the obese child-ren (n=5) were compared with the non-obese children, although the proportion of those having higher-than-desirable values for blood lipid and insulin was higher among obese children, the difference was statistically non-significant (Fig. 3). Discussion Obesity, particularly higher level of body fat percentage, is mostly predictive of a higher risk of dyslipidaemia and hyperinsulinaemia even in childhood and adolescence (1,4,16,45-49). Studies with lifestyle interventions have been effective in reducing the risk even in children having a positive family history of coronary heart diseases. Our observations indicate that, even in a group of non-obese children, arm-fat percentage is positively associated with biochemical risk indicators. In our sample, according to the internationally-recommended criterion of BMI-for-age, only five children were obese. Although they showed a higher level of risk compared to the non-obese children, the difference was not statistically significant. Comparison of three terciles for BMI-for-age did not provide evidence of any statistically significant difference in occurrence of any lipid or insulin abnormality. Multiple regression analysis identified arm-fat percentage as a predictor of insulin and LDL levels. In the present study, LDL and insulin levels were predicted by arm-fat percentage but not by other parameters of obesity, such as WHR or BMI. In a few other studies also, body fat rather than body weight has been found to have a closer association with cardiovascular disease or risk for developing diabetes (40,51). These observations indicate that, if only internationally-recommended reference values of BMI-for-age are used for identifying children having a risk of developing metabolic abnormalities, a large proportion of children can be missed. In adults also, it has been verified that cut-off values of BMI should be lower for South Asians. Similarly, among South Asian children also, the criterion of assessing fatness needs to be reviewed. The observations made in this study indicate that arm-fat percentage could emerge as an age independent tool for screening high-risk children. In adults, abdominal obesity is considered to be a good marker of a metabolic risk, but in growing and non-obese children it may not be a useful indicator. Assessment of arm-fat percentage requires portable, mechanical and reusable equipment only and, thus, is not very expensive. However, taking accurate skinfold thick-ness and calculating arm-fat percentage need training. If the observers are sufficiently trained in taking skinfold thickness and leaflets having pre-calculated values of arm-fat percentage for various combinations of skinfold thickness and mid-upper arm circumference are designed to omit calculations, these techniques could prove to be inexpensive, quick, and easy. Several other studies have already shown that fatness could be used as a basic screening tool for identifying children having a relatively higher risk for developing any metabolic disorder in later life (7,19,50, 52-54). We need to make sufficient observations to devise feasible and appropriate techniques of assessing fatness in South Asian children. Physical activity has been found to be an effective intervention in reducing body fat and increasing insulin sensitivity (50,51,55,56) and, thus, could be targeted at as a preventive measure. The general health-education programmes should aim at increasing physical activity level of children and encouraging a balanced diet in all children regardless of body weight, fatness, or family history. Families with a positive history of diabetes or heart disease should be educated to encourage healthy lifestyle in their off-spring. Measurement of skinfold thickness needs to be included in regular health assessment of children at school or elsewhere to identify children needing further attention. Further studies need to be done to ascertain accurate associations among arm-fat percentage, lipid profiles, and insulin levels in a larger group of children. We need to identify levels of arm-fat percentage that indicate the risk level at which interventions are needed in Pakistani children. There has not been much work among South Asian children in the area of predicting metabolic disorders or screening high-risk groups. This study has shown that even at a young age a proportion of children have higher-than-normal lipid and insulin values. The observation that metabolic abnormalities are found in children who are not classified as obese according to international standards has important implications. Furthermore, while arm-fat percentage had some ability to predict lipid and insulin levels, gender, family history of diabetes or heart disease, BMI, and WHR did not. Proportion of children having higher-than-normal values for lipids and insulin had higher arm-fat percentage. As found in several other studies, body fat could predict initiation of dyslipidaemia and insulin sensitivity in children. Arm-body percentage probably reflects fatness better than WHR and BMI and, thus, was found to have some ability to predict insulin and LDL levels in children. Studies on comparing various field methods of assessing body fat with more invasive and accurate laboratory methods could help identify the most appropriate method of screening children. Using certain more accurate field methods of body-fat assessment, such as skin-fold, of four sites was not feasible due to the setting and scope of the study. Development and use of skinfold thickness or arm-fat percentage could prove to be an effective screening tool and would hopefully contribute to the future health of Pakistani children. This study, because of its setting, cannot provide national or regional prevalence rates; however, it does demonstrate that metabolic abnormalities are present in Pakistani children. Development and use of skinfold thickness or arm-fat percentage could prove to be an appropriate screening tool. In further studies, it could be assessed that, among children, whether assessment of body fat by skinfolds of four sites, has any additional predicted value over arm-fat percentage or not. It is hoped that exploration of the potential of arm-fat percentage to predict risk status of Pakistani children could be used for developing cost-effective screening and intervention programmes to safeguard against escalation of rates of obesity and heart disease in South Asia. Acknowledgements Authors are grateful to 'PharmEvo' Pakistan for providing financial support for this study. References
© 2005 ICDDR,B: Centre for Health and Population Research The following images related to this document are available:Photo images[hn05005f1.jpg] [hn05005t3.jpg] [hn05005t1.jpg] [hn05005f3.jpg] [hn05005t5.jpg] [hn05005t2.jpg] [hn05005t4.jpg] [hn05005f2.jpg] |
| |||||||||