 |
| About Bioline | All Journals | Testimonials | Membership | News |
|
||||||
|
||||||
Journal of Health, Population and Nutrition, Vol. 23, No. 1, March, 2005, pp. 66-73 Intra-class Correlation Estimates for Assessment of Vitamin A Intake in Children Girdhar G. Agarwal1; Shally Awasthi2; Stephen D. Walter3; 1Department of Statistics, Lucknow
University, Lucknow, 2Department of Pediatrics, K.G. Medical College, Lucknow,
India, and 3Department of Clinical Epidemiology and Biostatistics, McMaster
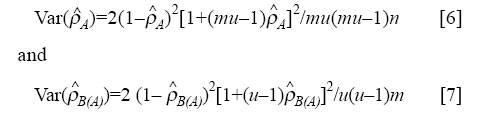
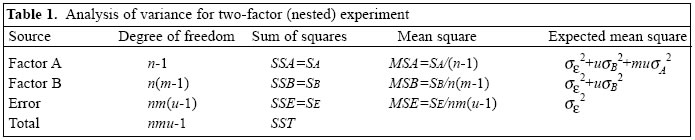
University, Hamilton, Ontario, Canada Code Number: hn05008 ABSTRACT In many community-based surveys, multi-level sampling is inherent in the design. In the design of these studies, especially to calculate the appropriate sample size, investigators need good estimates of intra-class correlation coefficient (ICC), along with the cluster size, to adjust for variation inflation due to clustering at each level. The present study used data on the assessment of clinical vitamin A deficiency and intake of vitamin A-rich food in children in a district in India. For the survey, 16 households were sampled from 200 villages nested within eight randomly-selected blocks of the district. ICCs and components of variances were estimated from a three-level hierarchical random effects analysis of variance model. Estimates of ICCs and variance components were obtained at village and block levels. Between-cluster variation was evident at each level of clustering. In these estimates, ICCs were inversely related to cluster size, but the design effect could be substantial for large clusters. At the block level, most ICC estimates were below 0.07. At the village level, many ICC estimates ranged from 0.014 to 0.45. These estimates may provide useful information for the design of epidemiological studies in which the sampled (or allocated) units range in size from households to large administrative zones. Key words: Vitamin A; Vitamin A deficiency; Sample size; Epidemiology: Child; India Introduction In most epidemiological studies, the units of observations are individuals. Individuals are usually nested within higher-level units of social organization. In community-based studies, subjects could be residing within households, which are located in villages, which are, in turn, situated in blocks or cities. In healthcare-based studies, individuals may be clustered within hospitals, health insurance plans, or physician practices. In these situations, it is inappropriate to estimate the effect of treatment with methods that assume the observations to be statistically independent. This is because, at various levels, individual responses within the same cluster are likely to be correlated (1). This interdependence of subjects can be introduced at each level of sampling. When a survey is carried out using cluster sampling, between-cluster variation at each level of sampling contributes an additional source of variation, which must be allowed for in addition to between-subjects, within-cluster variation, to validly estimate parameters or to test their significance. This means that the number of subjects needed for a cluster sample is larger than for a study of the same power in which individual subjects are randomly sampled (2,3). To estimate the required sample size, the design effect or variation inflation factor (VIF) must be incorporated into the sample-size formulae (4,5). VIF is the ratio of the variance of an over-all sample mean estimated from cluster means to the variance of an overall sample mean estimated from subjects within clusters. VIF is a function of the average cluster size and the intra-class correlation (ICC) for the out-come variable under study (6): VIF=1+(v-1) ρ where v is the average number of subjects per cluster and ρ is the ICC for the outcome variable. The intra-class correlation coefficient (ρ ) measures the degree of similarity among responses within a cluster. This parameter, ρ , may be interpreted as the standard Pearson's correlation coefficient between any two responses in the same cluster (see equations [4] and [5]). In designing cluster-based surveys or intervention studies, accurate estimates of ICCs are required from previous studies. However, there are relatively few publications (7-14), which present these estimates when reporting trial results. Vitamin A plays an important part in the body's defenses against infection. The importance of early recognition of vitamin A deficiency (VAD), particularly in young children, is essential not only in the preservation of sight but in many instances in saving a young life. The World Health Organization states that VAD is a major public-health problem in around 96 countries, including India (15). The national consultation on the "Benefits and safety of administration of vitamin A to preschool children and pregnant women", held at New Delhi in September 2000, concluded that VAD exists as a public-health problem in scattered pockets of India, especially in rural areas. The availability of ICC values for the assessment of VAD and VAD-related outcome variables will be necessary for designing future studies for the control of VAD, especially in young children. This is very important in view of the wide variation in the prevalence of VAD disorders between districts (16). Consequently, the aim of this paper is to provide estimates of ICCs (with standard errors) for some important VAD-related controlling and mediating variables in a rural district-based sample. The estimates of ICCs and components of variance presented here could also provide guidelines for planning studies involving the nutritional status of populations, particularly in relation to micronutrient deficiencies and intervention studies to combat them. The use of these estimates to calculate sample sizes for future studies on malnutrition is illustrated by suitable examples. Materials and Methods Data Data for this study were collected from Hardoi district, a rural part of north India. The district, with an area of 5,986 sq km, has a population of 3,397,414 (17). This population is distributed in 19 administrative blocks (or towns) and 1,883 villages. In the first stage, eight blocks were randomly selected. In the second stage, 25 villages were randomly selected from each block. Finally, 16 households were chosen using systematic and purposeful sampling from each village. Only those households that had at least one child in the eligible age range were selected. Within the selected house-hold, one child was randomly chosen from all the eligible children. Thus, 3,200 children aged 0.5-3 years were selected for the study. Four well-trained teams - each comprising a medical officer and a non-medical research assistant - conducted the survey. The medical officer examined the child for Bitot's spot and interviewed the parents for nightblindness, immunization, and actual doses of vitamin A taken by the child during the past year. The research assistant used a questionnaire for obtaining data from the parents concerning their awareness of nightblindness and vita-min A dietary habits, focusing on the quantitative estimate of intake of vitamin A-rich food. Model We propose a linear model for our observations, reflecting the multi-stage sample design. We have a three-stage sampling and describe an individual observation as yijk=μ+Ai+Bj(i)+εk(ij) where yijk is the observation of the kth unit (child) in the i th first stage (block) sample, j th second stage (village) sample. Here i goes from 1 to n, j goes from 1 to m, and k goes from 1 to u. Ai denotes level i of factor A (block). The levels of factor B (village) are nested within levels of factor A, which is expressed by using Bj(i) in the mo-del. Here, both factor A and factor B are assumed to be random. The random errors, ek(ij), are nested within the levels of i and j. Each of the three variables on the right-hand side of equation [1] has expectation equal to zero and their variances are σA2, σB2, and σε2 respectively. The variance components in the above model can be estimated from the sum of squares from the usual analysis of variance table for testing the null hypotheses of equality of block effects and equality of village effects respectively. The mathematical expectations of different sum of squares are given in Table 1. Unbiased estimates of the variance components can be given by: 
Intra-class correlation coefficient ICC measures the dependence between any two members of the same cluster, such as a block (Factor A) or village (Factor B). It is the ratio of the variance components due to blocks or villages to the total variance (σy2) for individual children. Under the model [1], we have σy2=σA2+σB2+σε2 [3] ICC for the subjects within the blocks is defined as: ρA=σA2/(σA2+σB2+σε2 ) [4] ICC for subjects within the villages nested within the block is defined as: ρb(A)=(σA2+σB)/(σA2+σB2+σε2 ) [5] Since the responses of subjects within villages are more likely to be similar than responses of subjects within blocks, ρB(A) is always greater than or equal to ρ A. Note that ρ A=0 means that there is statistical independence among subjects of a block. On the other hand, ρ A=1 implies that there is total dependence among children of a block. All the responses of a block would then be identical, so that the total information supplied by the block is no more than that supplied by a single observation (13). This is a hypothetical example. In practice, we would mostly have 0< ρ A, ρ B(A)<1. Variables and measures The children were examined for the following clinical signs of VAD: (i) Bitot's spot (X1B) and (ii) Corneal xerosis (X2). The parents were interviewed to assess their know-ledge and practice relating to vitamin A-rich food: Vitamin A-rich food knowledge (VIT A FOOD). Eight questionnaire items were used for assessing the parent's knowledge of vitamin A-rich food. A parent's score on this scale was the number of items for which the parent answered correctly. Nightblindness reason's knowledge (NT BLIND CAUSE). Nine questionnaire items were used for assessing the parent's knowledge about causes of nightblindness in a child. A parent's score on this scale was the number of items for which the parent answered correctly. Nightblindness prevention and treatment knowledge (NT BLIND PREVENT). Ten items assessed the parent's knowledge about preventive measures and possible treatments for blindness. The number of items answered correctly gives the score on this scale. Food stuff useful for nightblindness knowledge (NT BLIND FOOD). From a list of nine food items, the number of items chosen correctly gives the score on this scale. Number of servings of animal source food per week (VIT ANIMAL SOURCE). This includes milk, milk pro-ducts, eggs, fish, and meat. Number of servings of plant source food per week (VIT PLANT SOURCE). This includes vitamin A-rich vegetables and fruits. Number of servings of vitamin A-rich food per week (VIT TOTAL). This is the total number of servings of animal source and plant source food. Deficient intake of vitamin A-rich food (VIT_ DEFI-CIENT). There is deficiency in intake of vitamin A-rich food if VIT TOTAL is less than or equal to six servings per week. The reliability coefficients (Cronbach's alpha, (18)) of various knowledge scales were examined. Analysis For each of the outcome variables, ICCs were calculated at both block and village levels. The variance components, σA2 (block level) and σB2 (village level), were estimated using equation [2]. Since our data were multilevel in a balanced design (number of children within villages and number of villages within blocks were equal), the mean squares required to estimate the variance components can be obtained using a two-factor nested random effect ANOVA model for balanced data (Table 1). For this purpose, we used the 'variance component' module of STATISTICA software. Following the estimation of variance components, ICCs for various out-come variables and measures were estimated using formulae [4] and [5]. For unbalanced design, MLn and MLwiN are the most extensive multilevel packages, written by researchers working at the London Institute of Education (19,20). The same models were used for continuous and bi-nary variables. In the case of binary variables, the point estimate of parameters was obtained by applying the standard analysis of variance (ANOVA) formula [2] to the (0,1) binary observations, where 0 denotes failure and 1 success (§ 6.2.1,13). For binary variables, the interval estimates were not attempted since the distributional assumptions of ANOVA are not met. For continuous variables, the approximate confidence intervals were calculated using the variance formula for ICC derived by Fisher (21):
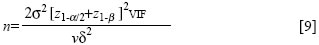
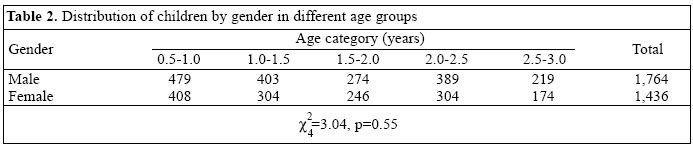
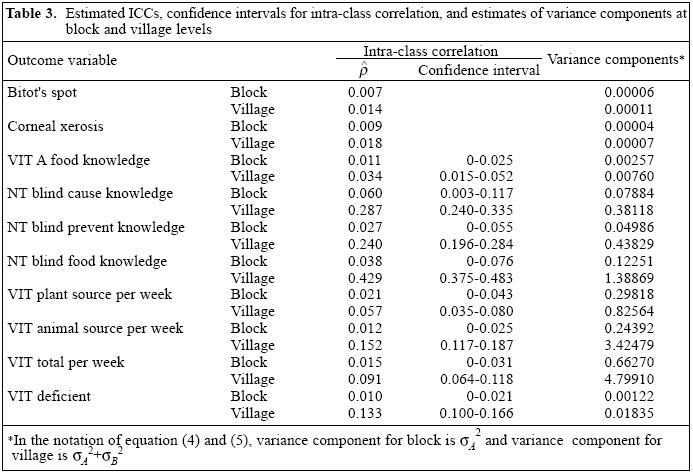
where u is the number of children per village, n is the number of blocks, and m is the number of villages. Results Of the original cohort of 3,200 children, 55.1% were males and 44.9% were females. Table 2 shows the distribution of male and female children in different age groups. The difference in distribution of male and female children in different age groups was not significant (p=0.55). The mean age of children was 20.5 months and standard deviation was 8.8 months. There was no significant difference between the average age (20.46 months) of male children and the average age (20.57 months) of female children (p=0.80). The reliability (Cronbach's alpha coefficient) of the four knowledge scores is given below: Vitamin A-rich food knowledge: 0.82 Nightblindness reasons knowledge: 0.60 Nightblindness prevention and treatment knowledge: 0.70 Food stuff useful for nightblindness knowledge: 0.80. Table 3 shows the estimated ICCs, 95% confidence intervals, and estimates of variance components for each of the outcome variables at the block and village levels. Only point estimates of ICC were calculated for bi-nary variables (clinical signs for VAD). The confidence intervals for the continuous variables were computed using normal approximation for the distribution of ICC estimates and the variances given in equations [6] and [7] respectively. Since the estimated parameter was non-negative, redefining it to be zero, when it was negative modified the lower limit of the confidence limit. As expected from their definitions, ICCs and variance components at the village level were higher than those at the block level. For example, ICC for vitamin A food knowledge was 0.011 at the block level and 0.034 at the village level. The block level ICCs ranged from 0.007 to 0.060. ICCs at the village level were below 0.3 for most variables. However, ICC for knowledge about food to prevent nightblindness at the village level was as high as 0.43. This indicates that the responses of the parents on the awareness of foods to prevent nightblindness within a village are moderately similar, but differ considerably between villages. Implication for future research The question of sample size is basic to the planning of any cluster-based studies. Decisions have to be made, first, on the number of clusters which should be selected and, second, on the number of units which should be selected from each cluster. We shall show that even very small ICC values can have a big impact on sample-size estimation. Several authors have discussed how to use ICC estimates in calculating the number of blocks needed per treatment condition to detect a treatment effect (22,23). We will illustrate below the use of the ICC estimates for sample-size calculation in testing the hypothesis about the difference between means of two treatment groups. Type I error is fixed at α, and we want the test to have power 1-β. If we were using simple random sampling, the sample size required would be (24):
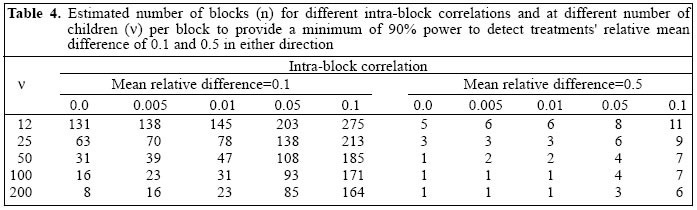
Here, N is the number of children required per treatment group, z1-α/2and z1-βare the values of standard normal variate for which the probability of smaller values is 1-α/2 and 1-β respectively, σ2 is the variance (assumed common) in each treatment group, and σ is the difference in either direction in the treatment means which we would want to detect. If we fix the number of children per block at , the number of blocks n required using simple random sampling will be obtained from [8], by taking N=nv To take into account the intra-block correlation, we have to multiply the variance by a factor of VIF, the variation inflation factor (22). So, the number of blocks required (using cluster sampling) for each treatment group will be:
where VIF=[1+(n-1)ρA] and the intra-block correlation ρA is defined in equation [4]. We shall use formula [9] in estimating the number of blocks when the probability of type I error (α) is 0.05 and power of the test (1-β) is 0.80. The values so obtained were rounded up to the nearest integer to get the required number of blocks. Table 4 gives the estimated number of blocks for different values of intra-block correlations, varying the number of children per block, n, from 12 to 200. These estimates are given when relative effect size is small (δ/ σ =0.1) and when relative effect size is medium (δ/ σ =0.5). We see that the number of blocks for each treatment combination increases as the ICC estimate increases. The value of ICC=0.0 corresponds to the simple random sampling situation. For larger cluster sizes, even small ICCs might have a substantial impact on the total sample size. For example, (a) when δ/σ =0.5, ρA=0.1, the total sample size (N) required using the number of children per block as 12 and 200 would be 12x11=132, and 200x6=1,200 respectively (last column of Table 4), (b) when δ / σ =0.1, ρA=0.01, the total sample size required using 12 and 200 children per block would be 1,740 and 4,600 respectively (column 4 of Table 4). In the calculations for Table 4, the number of children per block was assumed to be given (column 1). If the number of children per village was available and we were interested in estimating the required number of blocks, we shall require the estimates of intra-village correlations ρB(A),given in equation [5]. Discussion In this paper, we have presented ICCs for a range of outcome variables, which may be relevant in community-based studies. The types of units, which might be sampled in a community-based study, may vary in different districts, states, or countries, but the three levels which we have used for our data may be broadly generalized. The household, for example, will generally correspond closely to a family. The village corresponds fairly close to electoral wards. The blocks are often similar to small towns, counties, or section of cities. Despite a widespread appreciation of the need to obtain ICCs for the design of cluster-based studies, the data presently available are very limited. Murray et al. and Siddiqui et al. reported ICCs for measures of smoking behaviour in adolescents, with schools or classes used as the units of clustering (7,11). Mickey and Good-win studied variability in design effects estimated for mortality due to cardiovascular diseases and cancer among counties in the United States (9). Katz and colleagues analyzed data obtained from low-income countries and reported on the correlation of nutritional indicators (25), diarrhoea (26), cough and fever (27), and ocular disease (28) within households and villages. To the best of our knowledge, no one has previously published ICC estimates for the assessment of vitamin A deficiency and intake of vitamin A-rich food in children. Since our study was based on a large sample size and there was good representation by sex, we also expect the ICC estimates for the outcome variables to be generalizable. The general conclusions which can be drawn from the present study and similar other studies are that the variation inflation factors are often large and cannot be ignored. These factors may vary from one variable to another variable and from one study design to another study design. ICC is preferred compared to VIF, since the latter is dependent on the cluster. There exists an inverse relationship between the cluster size and the amount of between-cluster variation (29). Our data con-firm that ICCs tend to be larger for small clusters, such as villages, than for larger clusters, such as blocks. Our results are presented in such a way that they can be generalized to more than three levels of sampling using analysis of variance (Table 1). We have used STA-TISTICA software for calculating the variance components. If STATISTICA is not available, ICCs can alter-natively be derived from expected mean squares avail-able from standard ANOVA calculations (Table 1). How-ever, using the present methods, the exact estimates of parameters can be obtained for balanced designs. When there is a wide variation in the number of subjects from one cluster to another, the scope of the present methods is limited, especially for calculating the standard error of ICC estimates. An approach based on generalized estimating equation could be used (30), but these are not easily approachable, nor are they applicable when there are several stages of cluster sampling. References
© 2005 ICDDR,B: Centre for Health and Population Research The following images related to this document are available:Photo images[hn05008t2.jpg] [hn05008t1.jpg] [hn05008t4.jpg] [hn05008t3.jpg] |
| |||||||||

