 |
| About Bioline | All Journals | Testimonials | Membership | News |
|
||||||
|
||||||
Journal of Health, Population and Nutrition, Vol. 24, No. 1, March, 2006, pp. 89-99 Effect of Wealth Inequality on Chronic Under-nutrition in Cambodian Children Rathavuth Hong; Vinod Mishra; Demographic
and Health Research Division, ORC Macro, 11785
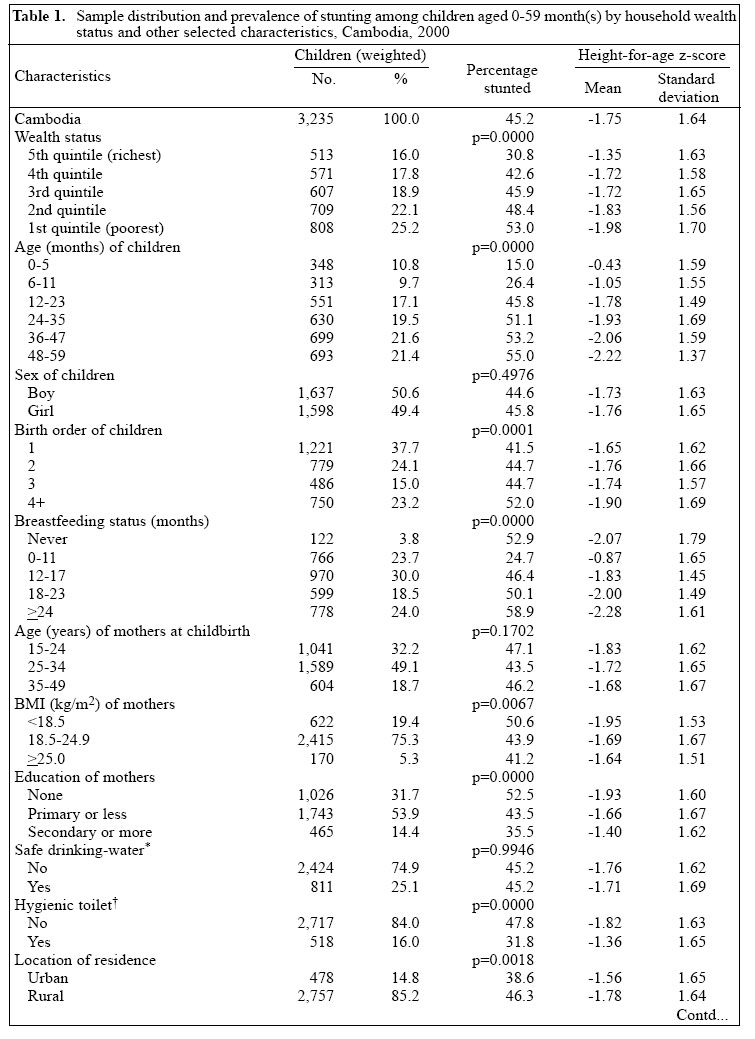
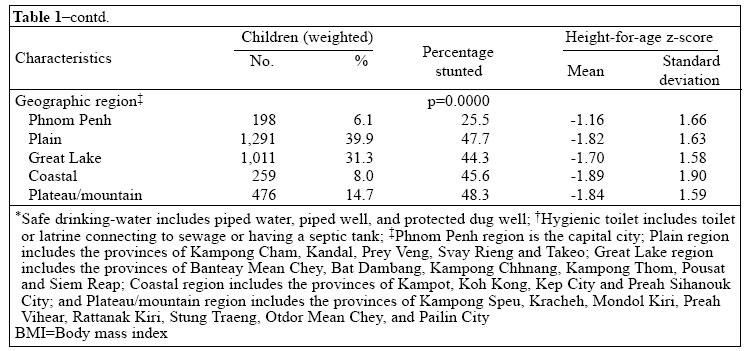
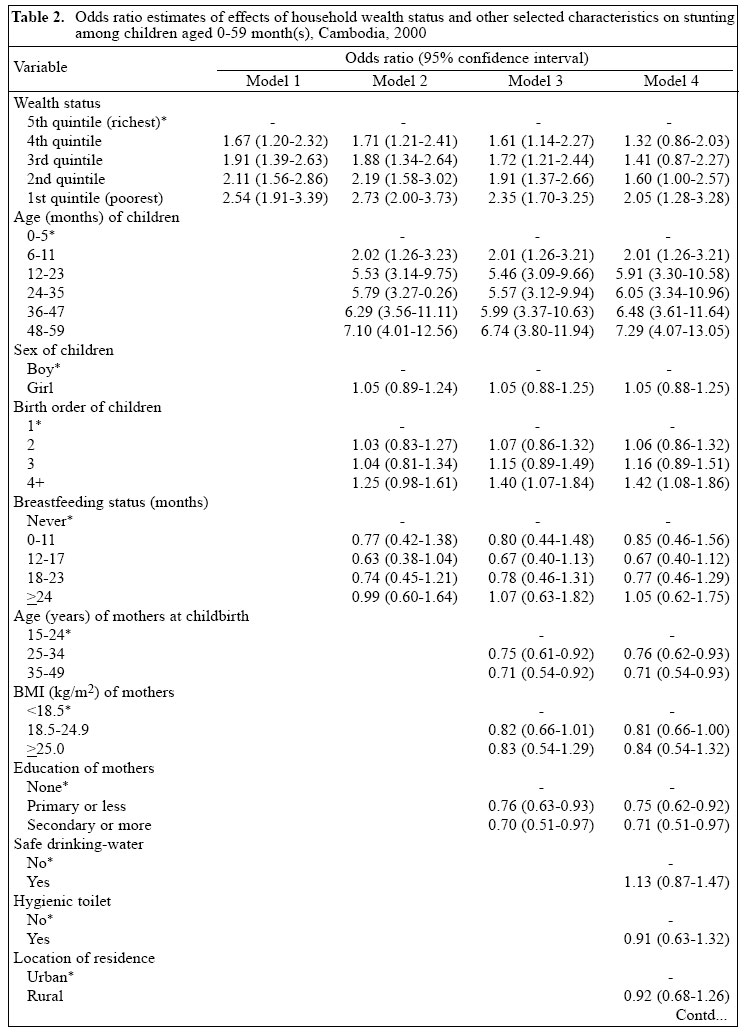
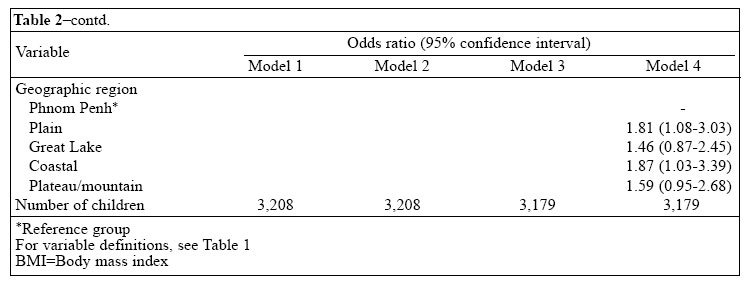
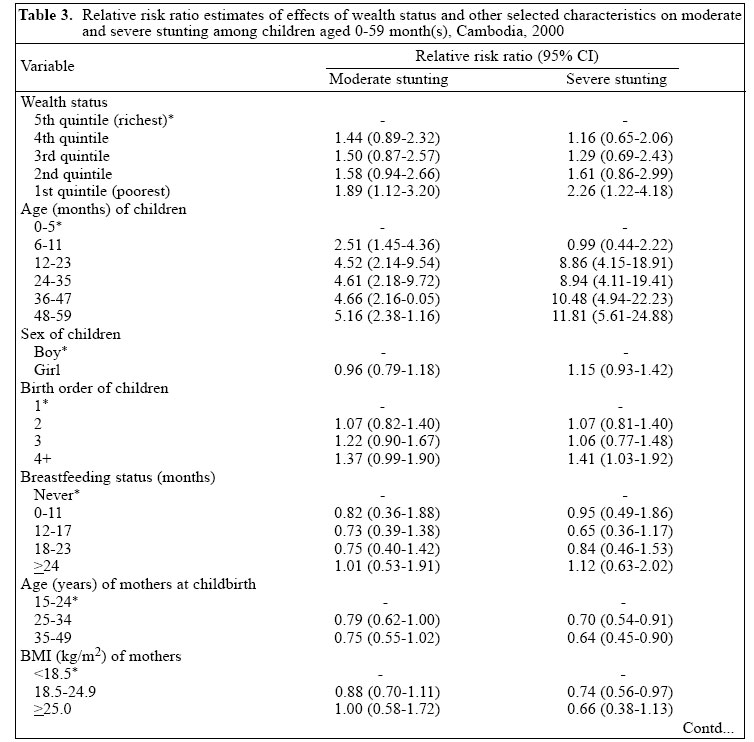
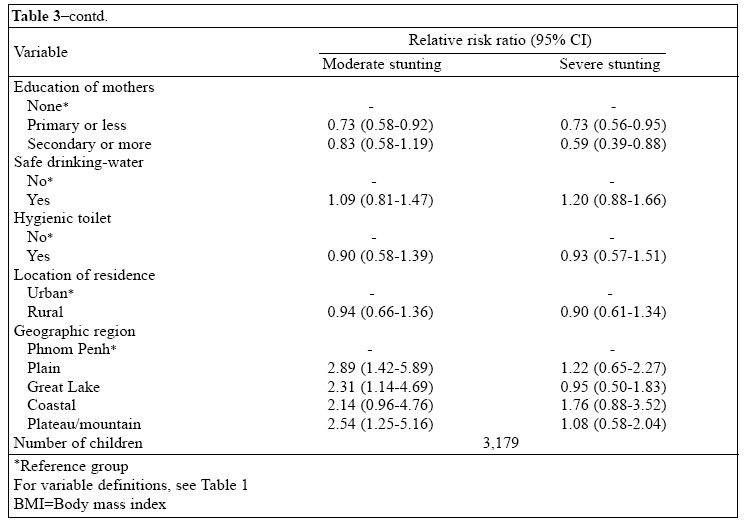
Beltsville Drive, Calverton, MD 20705, USA Code Number: hn06013 ABSTRACT The problems of food insecurity and under-nutrition remain particularly severe in countries recovering from recent wars or civil unrest, where improvements in economic conditions have tended to benefit the advantaged groups and resulted in widespread inequalities in health. Using information on 3,235 children aged 0-59 month(s) included in the 2000 Cambodia Demographic and Health Survey, this study examined how economic inequality was associated with inequalities in chronic childhood under-nutrition. An under-nourished (stunted) child was defined as having his/her height-for-age more than two standard deviations below the reference median. Household wealth status was measured by an index based on household ownership of durable assets. Binary and multinomial logistic regressions were used for estimating the effects of household wealth status on moderate and severe stunting. The results indicated that children in the poorest 20% households were more than twice as likely to suffer from stunting as children in the richest 20% households (odds ratio [OR]=2.54; 95% confidence interval [CI] 1.91-3.39). Adjusting for child's age, sex, birth order, and duration of breastfeeding; age of mother at childbirth, body mass index, and education; and household access to safe drinking-water, hygienic toilet facility, residence, and geographic region made little difference to this effect (OR=2.05; 95% CI 1.28-3.28). The adjusted effect of wealth status was somewhat stronger on severe stunting (relative risk ratio [RRR]=2.26; 95% CI 1.22-4.18) than on moderate stunting (RRR=1.89; 95% CI 1.12-3.20). The study concludes that wealth inequality is strongly associated with chronic childhood under-nutrition and emphasizes that reducing poverty and making services more accessible to the poor will be key to improving the health and nutritional status of children in Cambodia. Key words: Infant nutrition disorders; Child nutrition disorders; Infant nutritional status; Child nutritional status; Anthropometry; Stunting; Economic conditions; Poverty; Wealth; Inequality; Cambodia Introduction Despite impressive advances in health in recent decades, many in developing countries remain vulnerable to food insecurity, under-nutrition, and ill health (1). These problems tend to be particularly severe in countries recovering from recent wars or civil unrest (2). In such settings, health and nutritional benefits of economic growth tend to be concentrated among the advantaged groups (3-8). Cambodia is one such country where decades of civil war and violent conflicts have led to displacement, loss of livelihood, extreme poverty, and hunger for millions. Thirty-four percent of the country's population is estimated to be absolutely poor (with an earning of less than US$ 1 per day), mostly concentrated in rural areas lacking many basic amenities. A vast majority of the population does not have adequate access to food, clean drinking-water, or healthcare (9). More than one-third of the population is estimated to be chronically under-nourished. The problem of under-nutrition is particularly severe for young children (10). Recent improvements in economic conditions are believed to have benefited the rich more than the poor, and the effects of this wide and apparently growing economic inequality on health and nutrition are poorly understood (3,11). In Cambodia, as in many other developing countries, under-nutrition is one of the leading causes of childhood morbidity and mortality. Under-nutrition among children is often caused by the synergistic effects of inadequate or improper intake of food, repeated episodes of parasitic or other childhood diseases, such as diarrhoea, and improper care during illness (12). On the other hand, childhood under-nutrition affects physical and cognitive growth, impairs the immune system, and increases the risk of morbidity and mortality (13-15). In developing countries around the world, an estimated 148 million children are stunted, 127 million are under-weight, and 46 million are wasted (16). According to a recent comparative risk assessment by the World Health Organization, under-nutrition is estimated to be, by far, the largest contributor to the global burden of disease (17). Past research has linked childhood nutrition to education and nutritional status of mothers, employment of fathers, feeding practices, including breastfeeding, water supply and sanitation, access to healthcare, prevalence of parasitic and infectious diseases, health-seeking behaviour, race/ethnicity, rural residence, and social network and family support (3,18-24). Demographic characteristics, such as age and sex of child, birth interval (both preceding and following), and age of mother at childbirth, have also been associated with child nutrition (23,25). Economic growth does not benefit all sections of the society equally, and the resulting economic inequality within a country affects different sections of the society differently. Economic well-being at the household level operates mainly through availability of better food, more hygienic living conditions, and better access to health services in affecting the health and nutritional status of children. A number of studies have shown that children in poorer households tend to be more under-nourished than children in better-off households (3,4,20,26-28). Social deprivation has also been linked to nutritional status of children (29). However, the relationship between economic inequality and nutritional status of children is not conclusive. A recent study in Mexico found that house-hold poverty was not a necessary condition for children to be under-nourished (19). Another recent study in Ecuador found inconsistent evidence of a relationship between economic inequality and childhood under-nutrition (11). A study in Cambodia found that feeding practices, health-seeking behaviour, and personal hygiene are more important determinants of acute under-nutrition in children than food insecurity (18). A good discussion of the linkages between economic and health inequalities has been provided by Wagstaff (30,31). In this study, we examined how inequality in house-hold wealth status was associated with nutritional status of young children. Using data from a recent cross-sectional national survey in Cambodia, we examined the extent to which children in poorer households were at greater risk of chronic under-nutrition than children in richer households. Materials and Methods Analysis of data in this study was based on 3,235 children aged 0-59 month(s) included in the first Cambodia Demographic and Health Survey (CDHS) conducted in 2000. The CDHS collected demographic, socioeconomic and health data from a nationally-representative sample of 15,351 women aged 15-49 years in 12,236 households included in the survey. The sampling design allowed for province-level estimates for 12 large provinces and region-level estimates for 5 regions representing 13 smaller provinces and municipalities in the country. The master sampling frame for the CDHS was based on the Cambodia General Population Census, which consisted of 600 villages selected with probability proportional to number of households in the village. The sampling design was a three-stage stratified process with an overall household-response rate of 98.1% and an overall woman-response rate of 98.7%. The main CDHS report contains the details of the sampling design (32). To assess the physical growth and nutritional status of children, measurements of height/length and weight were obtained for all children aged 0-59 month(s). Details about these measurements are included in the survey report (32). The nutritional status of children in this study was measured by a z-score of height-for-age. Ratio of height and age served as a good proxy for the state of chronic under-nutrition among children, which was not much affected by recent episodes of ill health. A stunted (chronically under-nourished) child was defined as having his/her height-for-age more than two standard deviations below the median of an international reference population recommended by the World Health Organization (WHO) (33-35). Children with a height-for-age z-score below -2 standard deviations but above -3 standard deviations were defined as moderately stunted, and those below -3 standard deviations were defined as severely stunted. In multivariate analysis, we used two outcome variables of stunting: (a) not stunted, stunted and (b) not stunted, moderately stunted, severely stunted. In the first case, ’stunted’included both moderately and severely stunted. The 2000 CDHS did not collect direct information on household income and expenditure. This study used ’principal component analysis’(PCA) to estimate a household wealth index from asset variables that were significantly associated with, and represented for, per-capita expenditure defined in the 1999 Cambodia Socioeconomic Survey (36). This household wealth index was used as a proxy indicator for household economic status in this analysis (37). Economic inequality was measured by dividing the wealth index into quintiles, with the lowest quintile representing the poorest 20% households and the highest quintile representing the richest 20% house-holds in Cambodia. Since household wealth status is correlated with maternal nutrition and other sociodemographic factors that can also affect the nutritional status of children, the effects of household economic status on stunting were estimated after statistically controlling for the effects of these other potentially-confounding factors (38,39). These factors included child’s age (0-5, 6-11, 12-23, 24-35, 36-47, 48-59 months), sex (boy, girl), birth order (1, 2, 3, 4+), and duration of breastfeeding (never breastfed, 0-11, 12-17, 18-23, ≥24 months); age of mother at childbirth (15-24, 25-34, 35-49 years), body mass index (BMI) (<18.5, 18.5-24.9, ≥25.0 kg/m2), and education (no education, primary or less, secondary or more); household access to safe drinking-water (yes, no), availability of a hygienic toilet facility (yes, no), residence (urban, rural), and geographic region (Phnom Penh, Plain, Great Lake, Coastal, and Plateau/Mountain). Table 1a, b presents more details on variable definitions. The effects of wealth status and other factors on stunting were estimated using binary and multinomial logistic regression procedures in the Stata statistical software (40). A number of alternative logistic regression models were estimated to assess the relative significance of different confounding factors included in the analysis. We also carried out this analysis using a continuous response variable of height-for-age z-scores and using a linear regression model, but the results of this analysis (not shown) were similar to those from the binary and multinomial logistic regression models presented here. In the survey, certain categories of respondents were over-sampled and non-response rates varied from one geographical area to another. In our analysis, weights were used for restoring the representativeness of the sample (32). Results from binary logistic regressions are presented as odds ratios (OR), and results from multinomial logistic regressions are presented as relative risk ratios (RRR) with 95% confidence interval (CI). Estimation of standard errors takes into account design effects due to clustering at the level of the primary sampling unit. Ethics The study is based on secondary analysis of existing survey data with all identifying information removed. The survey obtained informed consent from mothers of children included in the study before asking any questions and before taking anthropometric measurements. Results One in every four children aged 0-59 month(s) lived in the poorest 20% households, and 16% lived in the richest 20% households (Table 1a, b). Children were more or less evenly distributed by age and sex. Thirty-eight percent of the 3,235 children were of first-order births, and 24% were of second-order births. Most (96%) children were breastfed, with about three-quarters (73%) being breastfed for more than one year. However, the prevalence of exclusive breastfeeding was low. The median duration of exclusive breastfeeding was less than 0.5 months (not shown in Table 1a, b) (32). About one-half (49%) of the children were born to mothers aged 25-34 years. For three-quarters of the children, the mothers had a normal body-weight (18.5 ≤BMI <25.0 kg/m2), 19% had under-weight mothers (BMI <18.5 kg/m2), and only 5% had over-weight mothers (BMI ≥25.0 kg/m2). The average height of women aged 15-49 years was 153 cm, and less than 6% of women were shorter than 145 cm (not shown in Table 1) (32). According to the guidelines of WHO, adult women of height shorter than 145 cm are considered under-nourished (41). About one-third (32%) of the children had illiterate mothers, and only one in seven had mothers with secondary or more education. More than three-quarters of the children lived in households without safe drinking-water (75%) or a hygienic toilet facility (84%). Only 15% lived in urban areas. By geographic region, two-fifths (40%) lived in the Plain region, and 31% lived in the Great Lake region. Only 15% lived in the Plateau/Mountain region, 8% in the Coastal region, and 6% in Phnom Penh. Overall, 45% of the children aged 0-59 month(s) were stunted (Table 1a, b). This figure represents a higher rate of under-nutrition than in the neighbouring Southeast Asian countries (42). The prevalence of stunting declined as the household wealth status increased from 53% in the poorest 20% of the households (the lowest wealth index quintile) to 31% in the richest 20% of the households (the highest wealth index quintile) (p=0.0000). The prevalence of stunting increased with age of child. The prevalence was considerably less common in the first six months of life, when children are more likely to be fully breastfed than at older ages. The prevalence increased rapidly up to 12-23 months of age, after which it increased more slowly. The prevalence of stunting did not vary much by sex of child. The prevalence was significantly higher among children of higher birth order, which is to be expected both because birth order is correlated with age and be-cause competition for food is likely to be greater in households with more children. Among children who had some breastfeeding, the prevalence of stunting increased with duration of breast-feeding. This may be partly because poorer mothers are more likely to continue breastfeeding as a substitute for appropriate complementary feeding. The prevalence of stunting was also higher among children who were never breastfed. There was a weak U-shaped relationship between age of mothers at childbirth and stunting. As expected, children of younger and older mothers were more likely to be stunted than those born to mothers in their prime reproductive years (25-34), but these differences were not statistically significant (p=0.1702). As expected, the prevalence of stunting was also strongly negatively associated with BMI and educational status of mothers. Children in households with an unhygienic toilet facility were significantly more likely to be stunted (48%) than in households with a hygienic toilet facility (32%). Contrary to the expectation, availability of safe drinking-water was not associated with prevalence of stunting. The prevalence of stunting was lower in urban areas (39%) than in rural areas (46%) and was much lower in the capital Phnom Penh (26%) than in other regions of Cambodia (43-48%). As expected, the differentials in the height-for-age mean z-scores by household wealth status and other characteristics followed a pattern similar to that discussed above for proportion stunted. Effect of wealth status on stunting The unadjusted odds of stunting were more than 2.5 times higher among children living in the poorest (the lowest wealth index quintile) households than among children in the richest (the highest wealth index quintile) house-holds (OR=2.54; 95% CI 1.91-3.39) (Table 2a, b, Model 1). The odds of stunting declined monotonically with in-crease in wealth status. Controlling for child's age, sex, birth order, and duration of breastfeeding further sharpened this relationship. In Model 2, with these characteristics of the child controlled, odds of stunting were 2.73 times higher in the poorest 20% households than in the richest 20% households. Additionally, controlling for characteristics of mothers--age at childbirth, BMI, and education--reduced the effect of wealth status slightly. In the full model (Model 4), when availability of safe drinking-water, hygienic toilet facility, urban/rural residence, and geographic region were also controlled, the effect of household wealth status on stunting remained large and statistically highly significant. With other factors con-trolled, children in the poorest 20% households were more than twice as likely to be stunted as those in the richest 20% households (OR=2.05; 95% CI 1.28-3.28). Table 3a, b estimates the adjusted effects of household wealth status on moderate and severe stunting separately, using the three-category response variable (not stunted, moderately stunted, severely stunted). The results indicated that the household wealth status had strong negative effects on both moderate and severe stunting, but the effect was somewhat stronger on severe stunting (RRR=2.26; 95% CI 1.22-4.18) than on moderate stunting (RRR=1.89; 95% CI 1.12-3.20). Effects of other risk factors and confounders Among the control variables, age of child had the strongest effect on the risk of stunting, and this effect was independent of wealth status and other maternal and household characteristics (Table 2a, b). With household wealth status and other factors controlled, birth order of child, age of mother at childbirth, BMI, and education of mother--all had statistically significant effects, but these effects were generally small. Also, the adjusted prevalence of stunting was significantly lower in Phnom Penh than in other regions. With other factors controlled in Model 4 (Table 2a, b), the effects of sex of child, duration of breastfeeding, safe drinking-water, hygienic toilet facility, and urban/ rural residence were small and not statistically significant. The effects of the control variables were generally similar for moderate and severe stunting, except that the effect of age was stronger for severe stunting and the effect of geographic region was stronger for moderate stunting (Table 3a, b). Separate analyses by sex of child and urban/rural residence We also carried out the above multivariate analyses separately for boys and girls and for urban and rural areas. The results of the analyses showed that the household wealth status had a strong negative effect on stunting in each case (results not shown). DiscussionThe association between poverty and under-nutrition is a manifestation of the somatic development pattern of children who live in poorer conditions with insufficient food intake, greater exposure to infections, and lack of access to basic health services (43). The results of the present study have shown that childhood under-nutrition was a serious problem in Cambodia and that children in the poorer households were at a much greater risk of being chronically under-nourished than children in the better-off households. Children in the poorest 20% house-holds were at more than twice the risk of being stunted than children in the richest 20% households, independent of age of child, maternal education and nutritional status, household access to clean water and sanitation, and other factors. The results hold separately for mode-rate and severe stunting and in separate analyses by sex of child and by urban/rural residence. These findings are consistent with findings of previous studies in other developing countries (27,28) and provide further evidence that household economic status is an important determinant of childhood under-nutrition in developing countries. Lack of sex differential in stunting in our study indicates that there is no intra-household gender bias in feeding and healthcare for children in Cambodia. An increasing pattern of stunting by age is consistent with the typical pattern of increasing prevalence of childhood diseases, such as acute respiratory infections and diarrhoea, by age in many developing countries (44). This may partly be due to the start of feeding solid foods at around 4-6 months of age, which increases the likelihood of consuming contaminated foods and removes the protection provided by breastmilk. Also, children start crawling at around this age and are more likely to be carried outdoors, which exposes them to infections. Contrary to the expectation, our analysis found no significant effects of duration of breastfeeding and household water and sanitation conditions on stunting in children. In previous research, education of mother was identified as one of the key factors in promoting health and nutrition, increasing earnings of households, and mediating the effect of economic status on health (45-48). In our analysis, maternal education had only a small effect on childhood stunting, and controlling for education did not alter the effect of household wealth status on stunting much. This may be partly because a large majority (86%) of mothers in Cambodia has less than primary or no education. One potential criticism of this study is that it does not control for diet and healthcare indicators. However, because household wealth status operates primarily through better access to food and healthcare in affecting child-hood nutritional status, our inability to control for dietary intake and access to health services is not a major limitation. Another potential criticism is the cross-sectional nature of our analysis, but because the causation runs primarily from household wealth status to childhood stunting, the cross-sectional effect estimated in this study is a good measure of the causal relationship between household wealth status and chronic under-nutrition in childhood. The study can also be criticized for using an indirect measure of household wealth. Because, in developing countries like Cambodia, it is hard to obtain reliable income and expenditure data; an asset-based index is generally considered a good proxy for household wealth status. Moreover, we were unable to account for the impact of exclusive breastfeeding on stunting because in Cambodia few children aged less than six months are exclusively breastfed. Despite these potential limitations, consistency in the direction and strength of the relation-ship between household wealth status and childhood under-nutrition suggests that reducing poverty and making services more accessible to the poor will be key to improving health and nutritional status of children in Cambodia. AcknowledgementsThe authors thank Altrena Mukuria and three anonymous reviewers for comments on an earlier draft of this paper. Partial support for this research was provided by the United States Agency for International Development (USAID) through the MEASURE DHS project (Contract no. GPO-C-00-03-00002-00). Views presented in the paper do not represent the views of the USAID or the organizations to which the authors belong. References
© 2006 ICDDR,B: Centre for Health and Population Research The following images related to this document are available:Photo images[hn06013t3a.jpg] [hn06013t2b.jpg] [hn06013t2a.jpg] [hn06013t1a.jpg] [hn06013t1b.jpg] [hn06013t3b.jpg] |
| |||||||||