 |
| About Bioline | All Journals | Testimonials | Membership | News |
|
||||||
|
||||||
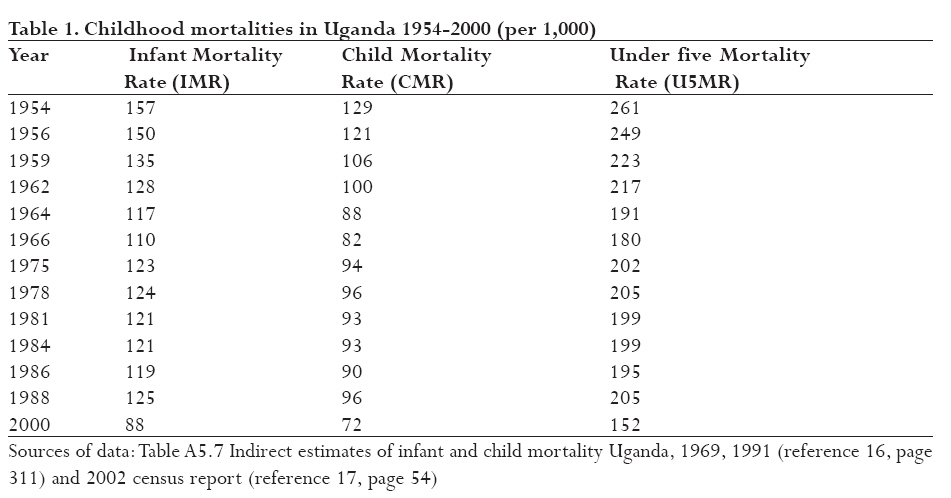
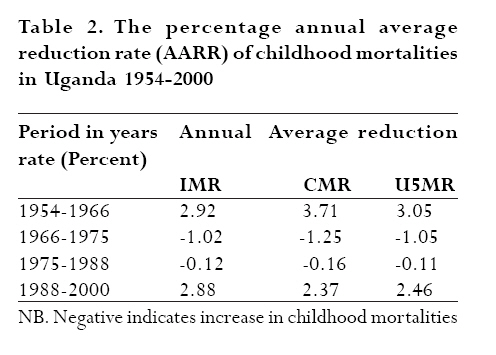
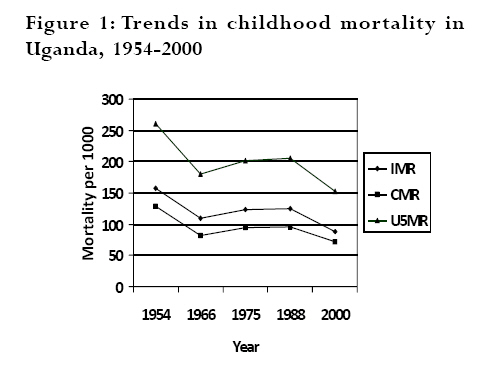
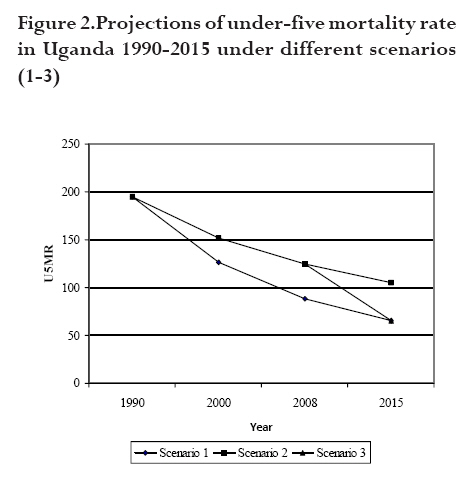
African Health Sciences, Vol. 9, No. 2, June, 2009, pp. 125-128 Trends in under-five mortality in Uganda 1954-2000: can Millennium Development Goals be met? Fred Nuwaha1, Andrew Mukulu2 Makerere University School of Public Health, P.O. Box 7072 Kampala-Uganda, Uganda Bureau of Statistics, P. O. Box 7186, Kampala Uganda Code Number: hs09021 Abstract Background: The under five mortality rate (U5MR) is measure of wellbeing and decreasing the U5MR by two thirds is the
target towards the achievement of the millennium development goal number four (MDG4).
Key words: Childhood mortality, Uganda, Millennium development goal, annual average reduction rate, child health, social economic development Introduction The childhood mortality indices covered in this report include the under-five mortality rate (U5MR) which is the probability of dying between birth and the fifth birth day, the child mortality rate (CMR) which is the probability of dying between exact age one and the fifth birth day and the infant mortality rate (IMR) which is the probability of dying between birth and the first birth day. 1 The U5MR and IMR are measured as deaths per 1000 live births whereas the CMR is measured as deaths per 1000 children who survive their first birth day. 1 Mathematically, U5MR = CMR*(1-IMR) + IMR. 2,3 The U5MR is regarded as a highly sensitive measure of population health. 4-11 This sensitivity is under pinned by the apparent association between the causes of under five mortality and other factors that are likely to influence the health status of whole populations such as their economic development, general living conditions, social well being, rates of illness, and the quality of the environment. 8 As a composite indicator, the U5MR measures changes in socio-economic development, provision of water and sanitation services, housing, nutrition, and access to quality health services. 6,7 Thus U5MR correlates well with social-economic development of the country as well as access to health care delivery and equity in distribution of resources and investment in health/social services. 5,9,10 The United Nations and its agencies use U5MR as measure of wellbeing and consequently decreasing the U5MR is one of the indicators for monitoring trends towards the achievement of the millennium development goal number four (MDG4) which is to reduce U5MR rate of the year 1990 to one third by the year 2015. 1 It is especially disturbing that U5MR rates in Uganda remain among the highest in Africa and the world. 9,12 The understanding of trends in U5MR is thus an important measure of public priority to gauge socio-economic progress and investment in public health. In this report we present the changes in U5MR in Uganda for the period 1954-2000 and project whether current trends are sufficient for Uganda to meet her MDG4. Methods The speed of progress in reducing the U5MR, CMR or IMR is measured by calculating the average annual reduction rate (AARR). 13 The AARR was calculated using an exponential formula U5MRa * (1-AARR) b-a = U5MRb, where a is the base year and b the target year. The formula for calculation of AARR assumes a continuous reduction between two points in time and does not take into account the intermediate values of the series. 14 Unlike the comparison of absolute changes, the AARR reflects the fact that the lower limits to U5MR CMR or IMR are approached only with increasing difficulty. To achieve a two-thirds reduction between 1990 and 2015 requires an AARR of 4.4% or higher. Setting In Uganda, childhood mortality rates have been typically computed using two approaches; direct and indirect techniques. Direct estimates have been computed from the four Uganda Demographic Health Surveys (UDHS) of 1988-89, 1995, 2000-2001 and of 2006 by using information collected from the woman's birth history. 1 On the other hand, lacking the necessary reliable information for producing estimates using direct methods, the population censuses report indirect estimates based on the number of children ever born (CEB) and children surviving (CS). 3 Although there is no conclusive evidence that one method is better than the other, indirect methods always provide estimates higher than the direct methods even when using the same set of data. 15 Thus as a result, childhood mortality indices derived using the two methods may not be comparable. Because the objective was to analyse trends in childhood mortalities over long time period (before data from UDHS was available) we only used data derived from population censuses. Data extraction Six population censuses have been conducted in Uganda (1948, 1959, 1969, 1980, 1991 and 2002). However, for purposes of this analysis only the 1969, 1991 and 2002 censuses were used. Data from 1980 census is not available whereas data from 1948 and 1959 censuses is not detailed enough to allow for analysis of trends. On the other hand, data from the 1969, 1991 and 2002 census was analysed using the same methodology thereby allowing for comparisons of trends to be made. 16,17 Because of the large inter-censual period between 1969 and 1991, data from these two censuses was analysed further to estimate the childhood mortality indices for the intervening years. 16 The data from the 1969 census provided estimates of probabilities of dying before age one (1q0) and between ages one and five (4q1) over a period of 12 years, roughly from 1954 to 1966. The data from the 1991 census provided estimates of 1q0 and 4q1 over a period of 12 years, roughly from 1954 to 1966. To calculate the probability of dying before age five years (5q0) the formula 5q0 = 4q1*(1-1q0 ) + 1q0 was used. All probabilities were then expressed as deaths per 1000 to get IMR, CMR and U5MR. The data from the 2002 census provided estimates of childhood mortalities around the period 2000. 17 The AARR for the U5MR, CMR and IMR was calculated for periods between 1954 and 1966, between 1966 and 1975, between 1975 and 1988, and between 1988 and 2000 to allow for comparisons covering about 12 years. Projections were then made for the U5MR using 1990 as a base year up to 2015 under three scenarios. First was by assuming the AARR of 4.4% required to reduce the U5MR rate by two thirds, second was the estimation of U5MR given the current levels of AARR and the third scenario was by estimating the AARR required to reduce the current U5MR (of 2008) to the 2015 figure (as projected using AARR of 4.4% from the base year of 1990). The formula used for projections was U5MR 1990 *(1-5q0)n = U5MR 1990+n where U5MR 1990 was the U5MR in 1990, 5q0 is the probability of dying before five years, n is the number of years after 1990 and U5MR 1990+n is the U5MR n years after 1990. The years 1990 and 2015 were used in the projections as they are the ones targeted in MDG4. The projections assumed the same AARR during the time intervals used in different scenarios. Ethical considerations This study was approved by Makerere University Institute of Public Health Institutional Review Board and by the Uganda National Council for Science and Technology. Permission to use the raw data was obtained from Uganda Bureau of Statistics (UBOS). Results Tables 1,2 and figure 1 show that during the period 1954-1966 the under five mortality rate registered a steep decline but during the period 1975 to 1988 it deteriorated to a level which was substantially higher than that achieved in 1966. The period between 1988 and 2000 is also characterised by a rapid decline. However the rate of decline for the period 1988-2000 is lower than that achieved during the period 1954-1966. As expected the same trends are observed for the infant mortality rate as well as for the child mortality rate (tables 1, 2 and figure 1). Furthermore, the rates of increase in childhood mortalities observed during the period 1966 to 1975 appear to have slowed down during the period 1975-1988. In 1990 the U5MR for Uganda was 195 deaths per 1000 live births. Figure 2 shows the projections of U5MR under three scenarios 1-3. If Uganda attained and maintained the AARR of 4.4% necessary to attain MDG4, the U5MR in 2000 should have been 126 deaths per 1000 live births, be 88 deaths per 1000 live births in 2008 and should be 65 deaths per 1000 live births in 2015 (scenario 1). However, the real situation shows that the AARR of U5MR was actually 2.46% for the period 1988-2000 (table 2) and therefore the U5MR in 2000 was 152 deaths per 1000 live births. Projections in 2008 at the AARR of 2.46% gives an U5MR of 125 and similar projections in 2015 would give an U5MR of 105 deaths per 1000 live births (scenario 2). Assuming that the U5MR in 2008 was 125 the AARR required to reach the 2015 MDG4 target of 65 deaths per 1000 live births would be 8.92% (scenario 3). Discussion The analysis shows that between 1954 and 2000, the trends in childhood mortality rates were characterised by three phases. First the initial phase of steady decline up to 1966, followed by deterioration and or/stagnation for the period between 1966 and 1988 and third a phase of decline between 1988 and 2000. However, the AARRs for the 1990s are generally lower than the AARR for the 1960s possibly due to the effect of HIV epidemic that is estimated to have increased U5MR in Uganda by about ten percent. 18 The overall trends from 1954 to 2000 may not be surprising, given that major distal factors of child survival are political stability, economic progress coupled with investment in social and health services. 4-11 From 1954 to 1971, there was general economic boom for Uganda with no external debt. The Gross Domestic Product (GDP) per capita during that time increased from $566 to $656. 19 This economic boom was characterised by general political stability with heavy investment in social services. On the other hand, the stagnation in childhood mortalities between 1966 and 1988 is attributed to the effect of general decline in the level of living resulting from the prolonged civil strife (the two wars) in the country from the 1970s and early 1980s, and Idi Amin's regime which also lead to deterioration of social infrastructure. 20-22 The civil strife during the Idi Amin's regime also led to the shrinkage in the GDP from $ 656 in 1971 to $443 in 1980. 19 After 1986 however, the GDP per capita steadily continued to increase from $631 to the 2000 figure of $941. 19,20 If the AARR in under-five mortality of 3.05% observed in Uganda between 1954 and 1966 had continued at the same pace for the entire study period, the U5MR in 2000 would have been about (261*(0.9695)46) = 63 deaths per 1000 live births. The U5MR rate in 2000 was instead 152 deaths per 1000 live births (more than 2 times as expected). Evidence from other countries (e.g. Srilanka, Vietnam and Kerala state in India) that have maintained a steady decline in U5MR show that such decline could indeed be achieved in about the same period of time. 6,23,24 Based on the target of MDG4 to decrease U5MR by two thirds from 1990 to 2015 the Uganda U5MR is supposed to decrease from 195 to 65 deaths per 1000 live births. The AARR in U5MR needed to achieve this goal is 4.4% for a period of 25 years. However, at the current level of AARR in Uganda of about 2.46% reducing U5MR from 195 to 65 deaths per 100 live births would require 44 years. The projected U5MR in Uganda in 2008 using the AARR of 2.46% is about 125 deaths per 1000 live births. Assuming that the same rate of AARR is maintained, the U5MR of 65 deaths per 1000 live births will be achieved in 2027 (27 years from 2008). In order to able to reach the U5MR MDG4 target for Uganda of 65 deaths per 1000 live births the AARR in the remaining seven years will have to increase from 2.46 to 8.92% (an increase of more than 3.6 times!). Thus it is unrealistic to expect that Uganda can meet the 2015 MDG4 U5MR target in the remaining time given the current trends. Acknowledgements This work was funded by the Department for International Development (DFID) under the Team for Applied Research to Generate Effective Tools and Strategies for Communicable Disease Control (TARGETS) consortium. We are grateful to the Uganda Bureau of Statistics for allowing use the census data. References
Copyright © 2009 - Makerere Medical School, Uganda The following images related to this document are available:Photo images[hs09021t1.jpg] [hs09021f1.jpg] [hs09021f2.jpg] [hs09021t2.jpg] |
| |||||||||