 |
| About Bioline | All Journals | Testimonials | Membership | News |
|
||||||
|
||||||
African Health Sciences, Vol. 11, No. 2, April-June, 2011, pp. 240 - 243 Reference values for Serum levels of Folic acid and Vitamin B12 in a young adult Ugandan population *Galukande M1, Jombwe J2, Fualal J2, R Baingana3, Gakwaya A2 1Department of Surgery, School of Medicine, College of Health Sciences, Makerere University *Correspondence author Dr. Moses Galukande Department of Surgery College of Health Sciences Makerere University Email: mosesg@img.co.ug Code Number: hs11036 Abstract Introduction: Reference values may vary significantly among populations and cultures for which dietary intakes may
be different. Each laboratory is expected to investigate the transferability of the expected values to its own patient
population and if necessary determine its own reference ranges. This study sought to establish Folic acid and Vitamin
B12 reference values for young Ugandan adults, which reference values could be used as baseline information for future research,
especially related to their role in breast cancer prevention.
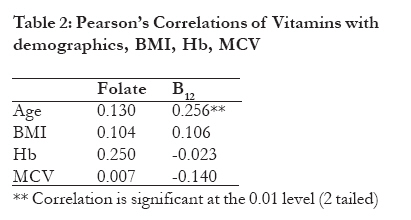
Key words: Reference Serum levels, Folic acid, Vitamin B12 Introduction The reference values that we find in textbooks and standard laboratory manuals may vary significantly among populations and cultures for which dietary intakes may be different1, 2, 3. Each laboratory is expected to investigate the transferability of the expected values to its own patient population and if necessary determine its own reference ranges. Reference values for various blood parameters are often obtained through sampling young individuals with a high probability of good health, or a mix of both healthy and non-healthy individuals recruited in hospitals or other health facilities4. Folic acid and Vitamin B12 are water-soluble vitamins important for nerve, brain function and haemopoesis; they are coenzymes for the synthesis of serotonin and catecholamine neurotransmitters5, 6, 7. Folic acid has lately been linked to protection against Cancer of the colon and Cancer of the breast8-12. Its protective effect on neurotubal defects in utero is well known13. Studies suggest that Vitamin B12 too is neurotube defect protective 14. The impact of multiple potential confounders15-17 on serum vitamin levels namely age, sex, alcohol, consumption, smoking, BMI (Body Mass Index), Hb (Haemoglobin) MCV (Mean Capsular Volume) ought to be examined as potential covariates in such studies. This study sought to establish Vitamin B12 and Folic acid reference values for young Ugandan adults, which reference values could be used as baseline information for future research, especially related to protective role of folate against breast and colon cancer. Methods A Cross-sectional descriptive study carried out among university undergraduate students. Two hundred Makerere University College of Health Sciences students out of a population of about 700 responded to a call to volunteer, after the objectives of the study and the processes involved were communicated to them. The minimum sample size was 126 (95% confidence interval and using Open Epi Version 218 used as appropriate for a descriptive one group cross sectional study), the lowest proportion of folate and vitamin B deficiency in a population taken to be 9% (5-15%)19. A pre-tested questionnaire was used for data collection. It included drug history, past illnesses, current health status, smoking and alcohol intake and physical examination including; blood pressure, height and weight. Weight and height (without shoes and with light clothing) were determined using an analogue weighing scale (range: 0.1 120kg) and a stationary tape measure for height. The data allowed for the calculation of each subject's body mass index (in Kg m-2) Individuals on treatment for Vitamin B12 or folate deficiency or on drugs known to interfere with Vitamin B12 or folate uptake such as anticonvulsants, peptic ulcer drugs, trimethoprim and hydrazides were asked not to participate. All participants consented to the study. Permission was obtained from Makerere University, Faculty of Medicine Ethics and Research committee. All samples were drawn over a two-day period during the day between 9am and 4pm. Owing to this range of blood sampling times participants were not fasting. About 3 mLof blood was drawn into plain vacutainer tubes using standard procedures and serum was separated by centrifugation. Elecys 2010 analyzer was used in the laboratory for assay for folate and B12. For sample processing tube and kit manufacturing instructions were followed. Specific performance data provided by the manufacturer indicates that precision data (reproducibility) and analytical specificity were within acceptable limits. Data analysis was done using SPSS 11.5 software, descriptive analyses and Pearson correlation coefficient methods were used. Results Of the 200 students enrolled for the study, 160 samples were successfully assayed for the folate and 133 samples assayed for Vitamin B12. We excluded 40 samples for folate and 67 for Vitamin B12 due to either poor quality of samples or rejection by machine or used for calibration purposes. The values obtained from this study ranged from 4.17 to 20ng/ml for folate levels and 117-1158pg/ml for Vitamin B12. When adjusted to the 2.5th to 97.5th percentile they read 4.36 to 17.68ng/ml and 152 to 1029pg/ml respectively. There was no borderline deficiency or deficiency for either vitamin. Pearson's correlation coefficient method was used to give information about the degree of correlation as well as the direction of these confounders (age, BMI, Hb and MCV) the degrees of correlation in table 2 lie around zero and 0.25. Indicating a no correlation to a low degree of correlation, implying the tested for cofounders did not significantly influence the ranges we see in this study. Alcohol and cigarette smoking are not shown in the tables, because none of the study participants admitted or indicated that they engage in either smoking or take alcohol on a significantly regular basis. As Table 2 shows, age was significantly correlated with vitamin B12 (r=0.256, p=0.01). Body mass index, Hb and MCV were not correlated with either folate or vitamin B12. Alcohol and cigarette smoking are not shown in the tables, because none of the study participants indicated that they either smoke or take alcohol on a regular basis. Discussion The main objective of this study was to establish reference values for serum folate and B12 among young health adults. The population studied was deemed representative of young health adults in the country, the Uganda Bureau of Statistics census data suggests that over 20% of the population falls in the age bracket studied19. The absolute figures for many of the hematological parameters studied in the sub-Saharan setting differ from those of populations outside Africa suggesting that it is necessary to develop tables of reference values for biomarkers indices specific for the African population21, 22, 23 Folate is a water soluble vitamin. Body stores are relatively small and liable unlike iron therefore temporary reduction of dietary intake of folate can produce short term (1month) folate deficiency. This is relieved by a few meals of folate containing foods. Vegetable and fruit are the usual sources of folate21. This implies therefore that when tests shown deficiency it is a reflection of some degree of inconsistence in the nature of the diet the individual takes on a regular basis. The influence of important potential confounders was examined. Most Ugandan schools prohibit smoking and alcohol for students, even though these are university students where such rules mostly don't apply, not indulging could be a `hang over effect from high school' or as result of high health consciousness, are plausible explanations. These expected values for folic acid in the test kits were as follows: Normal 3.1 17.5ng/ml (7.0 39.7 nmol/L) Values obtained in Australia (2 sites), Europe and in the USA for comparison purposes were; Australia site 1 ranged between 5.7 to >20.0 ng/ml (n =194), Australia site 2 ranged between 4.6 - >20.0 ng/ml (n=182), Europe ranged between 3.8 to 16.0 ng/ml (n=292) and USA ranges between 8.4 to 35.2 ng/ml (n=167). All these were 2.5th to 97.5th percentile ranges. The range for Vitamin B12 was 152 1029pg/ml (2.5th to 97.5th percentile in this study. The laboratory kit measuring range was 30 to 2,000pg/ml. These findings were comparable to values obtained in Germany and USA whose ranges were between 191 and 663 pg/ml (n=291), between 211 and 946 pg/ml (n=178), as 2.5th to 97.5th percentile ranges respectively. The study had several limitations. Dietary history was not taken, the study subjects for the most part live in the urban setting, there could be variations in the type of diet available in the rural and urban settings this could limit the generalizability of these findings, we also anticipate better availability of vegetables and fruits in most rural settings. Specimen collection was not conducted at exactly the same time of day for all subjects. The temperature and length of blood storage have been shown to cause alternations in the values for some hematological parameters, although these differences should have been randomly distributed through out the study population. All blood samples were transported at ambient temperature and were processed within the time limits recommended for these bioassays investigations. Conclusion The vitamin B12 and folate levels among this young adult population were comparable to values obtained from Western Europe and the USA. This is contrary to what would be expected given the fact that dietary intakes are expected to be different. A comparative survey of food intake could possibly shed light on these unexpected similarities. The values obtained here can be used as baseline data for further research. Acknowledgements Undergraduate students at the College of Health Sciences, Makerere University and the sponsors; SIDA and International Hospital Kampala References
Copyright 2011 - African Health Sciences The following images related to this document are available:Photo images[hs11036t2.jpg] [hs11036t1.jpg] |
| |||||||||