 |
| About Bioline | All Journals | Testimonials | Membership | News |
|
||||||
|
||||||
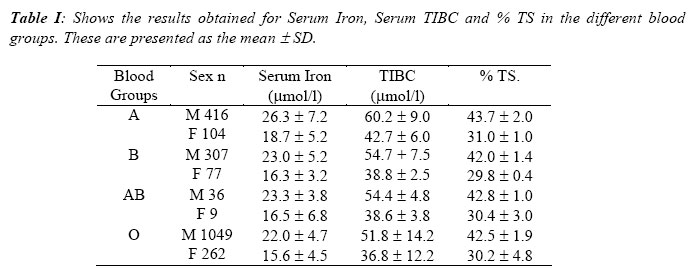
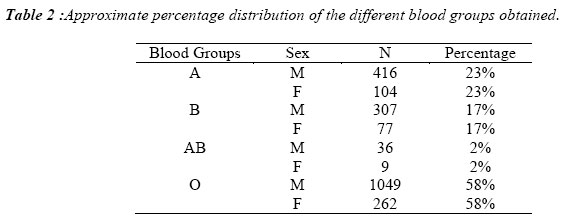
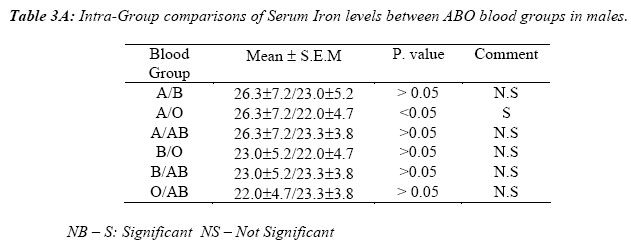
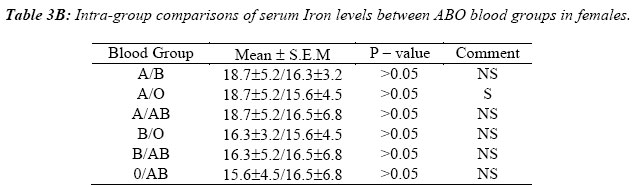
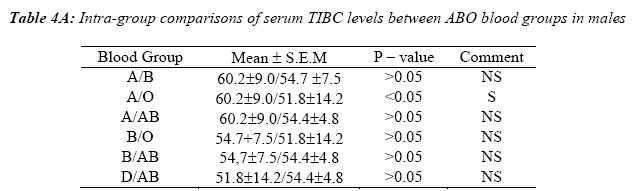
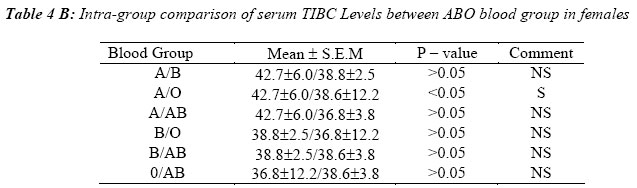
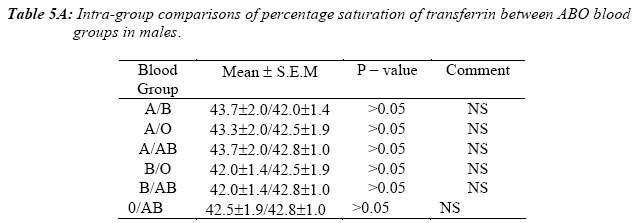
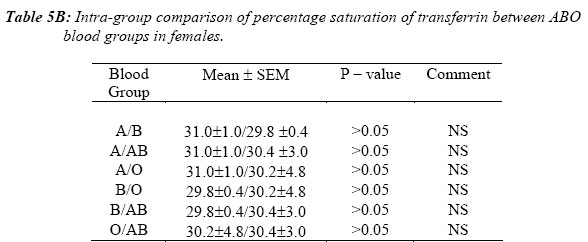
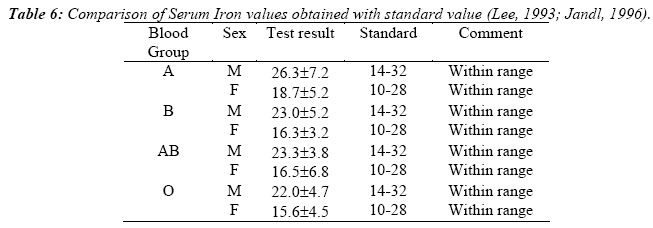
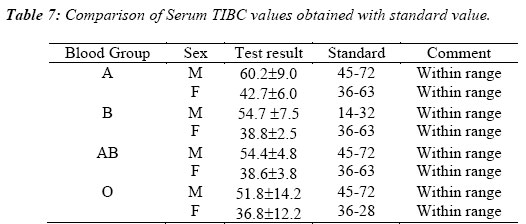
Nigerian Journal of Physiological Sciences, Vol. 21, No. 1-2, 2006, pp. 9-14 SERUM IRON AND TOTAL IRON BINDING CAPACITY LEVELS AMONG THE ABO BLOOD GROUPS IN ENUGU, SOUTH EASTERN NIGERIA. * W. C. NWAFIA1, J. O. ANEKE., C. U. OKONJI 1 Physiology Department College of Medicine University of Nigeria, Enugu Campus Enugu, Nigeria School of Medical Laboratory Sciences, University of Nigeria Teaching Hospital Enugu. Nigeria *E-mail: waltercares 007 @ yahoo.com Received: 18/1/06Accepted: 19/3/06 Code Number: np06003 Summary: Iron deficiency anaemia is a common tropical disease. Iron plays a very important role in the human body. The understanding of the different blood groups ability to retain iron in their system can give an insight into their ability to handle the disease Iron deficiency anaemia. Serum Iron, Total Iron Binding Capacity (TIBC) and Percentage Transferrin Saturation (%TS) levels were studied in 2260 apparently healthy Nigerian volunteers in Enugu, Eastern Nigeria. The ABO blood groups of the subjects were also determined. They were aged between 10 and 25 years, males were 1808 and females 452 (M/F ratio- 8:2).In all the results obtained, the females had lower values. Serum iron (micromol/L) was highest in the group A (26.3 ± 7.2 - males, 18.7 ± 5.2 -females) and lowest in group 0 (22.0 ± 4.7 males, 15.6 ±4.5 - females). Groups B and AB had values of 23.0 ±5.2 (males) 16.3 ±3.2 (females) and 23.3 ± 3.8 (males), 16.5 ± 6.8 (females) respectively. The TIBC value (micromol/L) was highest in group A (60.2 ± 9.0 - males, 42.7 ± 6.0 - females) and lowest in group 0 (51.8 0 ± 14.2 - males, 36.8 ± 12.2 - females), while the values for groups B and AB were 54.7 ±7.5 (males), 38.8 ±2.5 (females) and 54.4 ±4.8 (males), 38.6 Key Words: Serum Iron. Total Iron Binding Capacity. ABO Blood Groups. Transferrin Saturation. Introduction Iron is a very important requirement for the formation of RBC. It forms a major portion of Hb molecule, the oxygen carrying pigment in the blood. It is required for Hb synthesis. Iron liberated from old RBC is normally retained and re-utilized. Body Iron comes from both plant and animal sources. The form of iron present in the body includes ferrous (Fe 2+), ferric (Fe 3+), Hb, Haemosiderin, Myoglobin, Ferritin and Transferrin (Siderophilin). Iron is also an important constituent of the enzyme catalase, peroxidase and cytochrome – C. These are involved in cellular respiration. Serum contains a small amount of iron 14- 32 μmol/L (males) and 10-28 μmol/L (females) (Lee, 1993; Jandl, 1996) which is bound to the globulin fraction of serum proteins. The physical role of this proteinbound iron is the transportation of iron in the body. Low values of serum iron are found in haemorrhagic and hypochromic types of anaemia, while high values are found in pernicious anaemia etc (Jandl, 1996). Presence of iron in the body is estimated by the determination of Serum Iron and Total Iron Binding Capacity (TIBC) of blood, which is the serum iron level when the iron transport protein transferrin is completely saturated. The levels of TIBC in serum has been determined as 45 – 72 μmol/L (Jenkins and Williams,1969 ;Lee,1993), the value increasing in iron deficiency and in the last trimester of pregnancy, while low values occur in acute and chronic infections (Jenkins and Williams, 1969 ;Lee, 1993). The knowledge of blood grouping has helped tremendously in alleviating the complications hitherto associated with transfusion reactions. Interest in blood group research dates back to 1656, when Christopher Wren injected fluids into the veins of dogs (Ukaejiofor, 1996). The ABO blood group was discovered in 1900 - 1901 by Karl Landsteiner (Ukaejiofor, 1996). Blood group distribution in Nigerians (1gbo’s, Hausa’s and Yoruba’s) have been documented and compared with those of the British ((Ukaejiofor, 1996). There have been many documented evidence associating human blood groups with diseases. They include the protective effect of blood group O in rheumatic fever and its increased predisposition to duodenal ulcers (Glyn and Holborow,1969;Ukaejiofor, 1996) , increased occurrence in group A of pernicious anaemia (Ukaejiofor and Tagbo,1995) and Plasmodium Vivax malaria (Gupta and Chowdhuri,1980) etc. The present study was aimed at determining the levels of Serum iron and TIBC in different ABO blood group systems in our environment, with a view of inferring from the result the possibility of any tendency to iron deficiency in any of the blood groups. Materials and Methods Subjects A total of two thousand two hundred and sixty (2260) apparently healthy volunteers were used for the study. The study was carried out in Enugu, Eastern Nigeria. The subjects were all Nigerians irrespective of tribe. They were aged between 10 and 25years.Males were 1808 while the females were 452 (M/F ratio of 8:2). Using both physical sign (presence of parlor) and laboratory result (Hb ≤10gm/dl males and Hb ≤ 8gm/dl - females) the subjects who were anaemic were eliminated from the study. ABO blood groups, Serum Iron and TIBC levels of the subjects were determined. Sample Collection Under aseptic condition, 10mls of venous blood was collected from each subject by venepuncture using disposable pyrogen free needles and syringes (Becton – Dickson. Dublin, Ireland). The left antecubital vein was used. The collected blood was put into a well labeled acid-washed plastic test tube, allowed to clot, centrifuged at a speed of 10,000 rotations per minute for 10 mins. The serum obtained was decanted into another acid-washed test tube. The serum and the RBCs were stored at 40C until ready for analysis. The samples were all collected between 11am and 11.05am to avoid variations (Hamilton et al,1950; Delaney and Garratty, 1969; Worlledge et al, 1974; Statland and Winkel, 1997) Analytical Methods The ABO blood groups were determined using the standard method described by Baker and Silverton (Baker and Silveron, 1998). Serum iron estimation was done using the method described by Persijin et al, (1971).This same method was also used for the determination of Unsaturated Iron Binding Capacity (UIBC) from which TIBC and percentage transferrin saturation were computed. The % TS was derived from the formula. S1x 100 TIBC 1 Sigma iron and TIBC kit (Sigma Diagnostics, St. Louis, USA) was used for the estimation. Statistical Analysis Results for the pooled data, the different blood groups and for different sexes were expressed as mean ±SD. In the intra – group analysis, results were expressed as mean ±SEM and compared using one-way analysis of variance (ANOVA). P – values of ≤ 0.05 were considered to be statistically significant. ResultsTable I, shows the raw data obtained for the Serum iron, TIBC and percentage transferrin saturation (% TS) in both the males and the females. Table 2, shows the approximate distribution of the different blood group obtained in the study. Group 0 has the highest value while Group AB is the lowest. In Tables 3A and 3B, serum iron was only significantly higher between groups A and O in both the males and the females. When the intra group comparisons were made for the TIBC in both the males and the females in tables 4A, 4B only Group A were found to be significantly higher than group O. In Table 5A and 5B, no significant differences were obtained for the percentage transferrin saturation in the different blood groups for both the males and the females. When the values for Serum iron and TIBC in both males and females were compared with reported standard, in Tables 6 and 7 respectively, they were found to be within the normal range. Discussion Iron is an essential element required for many biochemical processes in the body. It plays a role in internal respiration and Hb synthesis. The different cellular antigenic composition of A and B blood antigens can be suggested to enhance or inhibit the ability of the different ABO blood groups to perform varying biochemical roles. Iron deficiency anaemia is characterized by low Serum iron, raised TIBC and reduced percentage saturation of transferrin (Teitz, 1982). The results obtained showed that the mean serum iron and TIBC are lowest in group O and highest in group A. However when compared with standard in the books (Jenkins and Williams, 1969; Lee, 1993; Jandl, 1996), they were within the normal range. The statistical differences in Serum iron levels and TIBC obtained between groups A and O individuals may be as a result of the higher Serum iron and TIBC obtained in group A. The percentage saturation of transferrin is relatively constant in the different blood groups studied and lies within the normal range of 25% and 45%. (normally 1/3 saturated by iron). (Katchmer and Grant, 1982). There is paucity of information regarding Serum iron, TIBC and % T.S in the various ABO blood groups, but various studies have associated relationships between them and diseases like peptic ulcer in group O and bronchopneumonia in group A (Glyn and Holborow, 1969). Some authors have associated increase Serum iron and TIBC with predisposition to infections, the free iron being available for bacterial growth (Kocham, 1973). Our results on the percentage distribution of different blood groups agree with those already documented in the same population (Ukaejiofor and Tagbo, 1995). ConclusionIn conclusion, though our study observed some differences between the Serum iron TIBC, and % T.S among the ABO blood groups in the population studied, they were all within the standard range. This study therefore provides useful data on Serum iron, TIBC and % T-S among the ABO blood groups in Enugu, South Eastern Nigeria. References
© Physiological Society of Nigeria 2006 The following images related to this document are available:Photo images[np06003t5a.jpg] [np06003t4a.jpg] [np06003t7.jpg] [np06003t6.jpg] [np06003t5b.jpg] [np06003t3a.jpg] [np06003t2.jpg] [np06003t1.jpg] [np06003t4b.jpg] [np06003t3b.jpg] |
| |||||||||