 |
| About Bioline | All Journals | Testimonials | Membership | News |
|
||||||
|
||||||
Nigerian Journal Of Physiological Sciences, Vol. 23, No. 1-2, 2008, pp. 1-3 The Relative Incidence Of Diabetes Mellitus In Abo/Rhesus Blood Groups In South-Eastern Nigeria U. A. Okon1, A. B. Antai, E. E. Osim and S. O. Ita1 Department
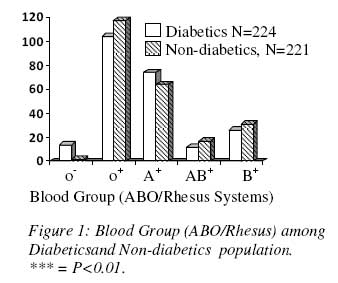
of Physiology, College of Medical Sciences, University of Calabar, Calabar, Nigeria. Code Number: np08001 Summary A total of 224 diabetics and 221 non-diabetics (control) were involved in this study, to determine the relative incidence of diabetes mellitus in ABO/Rhesus blood group. The current criteria for the diagnosis f diabetes mellitus were applied in differentiating the diabetics from the non-diabetics. Blood group, fasting blood sugar (FBS) and random blood sugar (RBG) were determined using standard methods. Type I, Type II and gestational diabetes mellitus were identified in this study. Biodata information were obtained during history taking and from subject hospital case note. The mean age of diabetics was 50.9 + 11.4 (SD) with age range of 24-72 years. Mean age for control was 49.21 + 9.25 with age range of 24-70 years. There were no significant differences between the mean ages of the two groups. Blood group O- and A+ were significantly (P<0.01) higher among the diabetics than non diabetics. Blood group O+ was significantly (P<0.01) lower in diabetics than in the control population. Blood group O- and A+ therefore appears to be more susceptible to diabetes mellitus. Key Words: Diabetes mellitus, ABO blood group, Rhesus factor Introduction It was long suggested that the ABO blood group system had evolved under a positive selection pressure in both humans and other primates (O’huigen et al., 1997). This implies that certain ABO groups provide a selected vulnerability to individuals possessing a particular ABO blood group. Researchers have made considerable attempts to determine the significance of particular ABO phenotypes to disease susceptibility. The relationship between ABO blood groups and disease susceptibility has generated a lot of interest. Individuals with blood group O have been found to be at a higher risk of contracting cholera than those with other blood groups. The ratio of this risk of group O to group A individuals has been reported as 1.35:1 (Issitt, and Anstee, 1999). Oral candidiasis shows a higher incidence of group O over other ABO groups (Burford-Mason, 1988; Thom, 1989). Small pox virus has been found to carry an A antigen-like structure, so that individuals who possess a naturally occurring anti-A (group O and B individuals) are thought to have an increased resistance to the infection (Vogel et al., 1960; Adalsteinson, 1985; Issitt and Anstee, 1999). Some ABO blood groups are also believed to have a higher incidence in certain malignancies; many tumors have been demonstrated in large trials to have a significantly higher incidence in group A individuals (Issitt and Anstee, 1999). This could be attributed to the inability of the immune system of group A individuals to recognize the A like antigen of the tumour cells as foreign and cannot destroy them, but group O and B individuals do have a naturally occurring anti- A that are most likely to destroy tumour cells (Issitt and Anstee, 1999). An individual ABO blood group can also be a risk factor in coagulation defect. It has been reported that group O individuals are proportionately more prone to bleeding than individuals of the other blood groups; and group A individuals with highest incidence of thrombosis than in any other group (Issitt and Anstee, 1999). This study was designed to determine the relative incidence of diabetes mellitus in the different ABO/Rhesus blood groups in South-Eastern Nigeria. Materials and Methods Two major and two make up centres were chosen for this study. The University of Calabar Teaching Hospital and the University of Uyo Teaching Hospital were the major centres. The make up centers included Heritage Specialists Clinic, Calabar and St. Luke’s Hospital, Anua, Akwa Ibom State all in South Eastern Nigeria A total of 445 subjects took part in this study with 244 making up the test group (diabetics) and 221 (non-diabetics) as control. There was no application of inclusion/exclusion criteria as basically all those attending routine diabetic clinics in the various centers were cooperative and eager to participate in the study. However, some subjects failed to offer some information they considered too personal. Application for permission to carry out the study was forwarded to the ethics and rules committee of the respective centers. The extent and purpose of the study were clearly explained and informed consent obtained from subjects. The rules on respect of person were duly observed. Subjects were interviewed and samples collected during their weekly diabetic clinic visit and the research questionnaire filled accordingly. The control groups were randomly selected from those on routine medical/surgical check-ups, confirmed to be non-diabetic. The blood samples were collected by venepuncture with 2 ml emptied into EDTA bottles and about 2 ml fixed in fluoride bottles. Blood sample in the EDTA bottle was used for blood grouping while that in the fluoride bottle was used for random and fasting blood sugar estimation as was applicable. Blood grouping was done according to method described by Dacie and Lewis (1991). Blood sugar estimation was carried out with glucometer. Sugar strip was inserted into a one stop glucometer, and a drop of blood was also placed on the sample spot. The meter automatically issued result in mg/dl after 45 seconds. This was converted to mmol/l by dividing by 18. The data were entered in Microsoft excel for analysis. Further analysis was carried out using instant graph-pad 2.5a. The chi-square and students t-test were employed to compare two sets of data. Analysis of variance was employed where comparison of three or more variables was involved. P<0.05 was considered statistically significant. Results The results as presented in table 1 show the blood groups (ABO and Rhesus systems) that were seen among the diabetics. When compared with control (non-diabetic) groups, those with O- and A+ were significantly higher among the diabetics than the non-diabetics. The values were 6.25%, 33.03% for diabetics with O- and A+ respectively, and 0.90% and 28.95% for non-diabetics with O+ blood group (46.42%) were significantly lower than the control population with O+ and A- respectively. However, diabetics with O+ blood group (52.91%), (P<0.01). Blood groups B and AB did not show any significant difference between the test and control groups, as illustrated in Figure 1. Table 1: ABO/Rhesus blood groups distribution among diabetics and non-diabetics
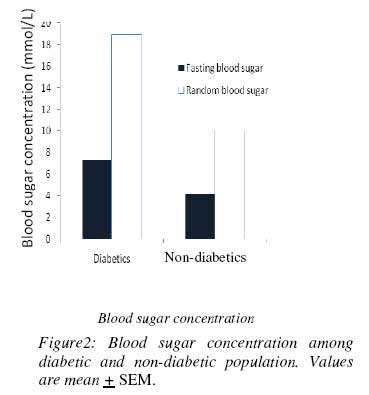
** = P<0.01; NS = NS = Not Significant Blood sugar determination was done. The mean values of the concentration of fasting blood sugar (FBS), and random blood sugar (RBS) as was applicable for diabetics and control groups are shown in Table 2. The diabetics had significantly higher fasting and random blood sugar concentration than the non-diabetics, (P<0.01). This illustrated in Figure 2. Table 2: Fasting and random blood sugar levels in diabetics and non-diabetics.
** = P<0.01; FBS = Fasting Blood Sugar; RBS = Random Blood Sugar. Discussion Diabetes mellitus was observed to occur in all the ABO/Rhesus blood groups. Both the Rhesus positive and negative were affected in group O. From the results presented above, blood group O+ had the highest prevalence among the diabetics (46.42%), although, comparatively this was significantly lower than the control group. On the other hand, there was significantly higher incidence of diabetes mellitus in blood group O- (6.25% and A+ (33%) subjects when compared to their distribution in the control group (0.9%) and 28.95% for O- and A+ respectively. Blood groups O- and A+had been previously reported to enjoy a higher incidence of other disease conditions namely; cholera, oral candidiasis, malignancies, coagulation defect and thrombosis (Daniels, 1995; Issitt, and Anstee, 1999). Are blood groups O- and A+ endangered “specie”? This is a subject for further research work. Several diabetics had a fairly good control of their blood sugar level, though the majority of them tilted to the above normal range. It has been noted that the risk of chronic complications increases as a function of the duration of hyperglycemia, while acute complications are directly related to the level of hyperglycemia (Ohkubo et al., 1995). The fairly good control of the blood sugar of subjects, possibly explain the low incidence of acute and chronic complications reported in this study. In conclusion, it is likely that O- and A+ individuals are more susceptible to diabetes mellitus. References
© Physiological Society Of Nigeria, 2008. The following images related to this document are available:Photo images[np08001f2.jpg] [np08001f1.jpg] |
| |||||||||
