 |
| About Bioline | All Journals | Testimonials | Membership | News |
|
||||||
|
||||||
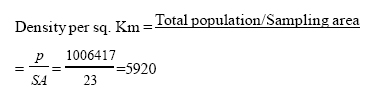
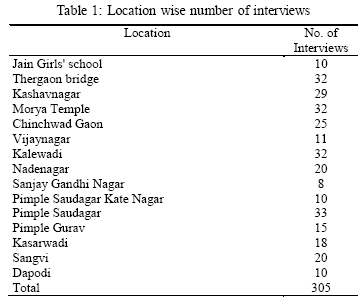
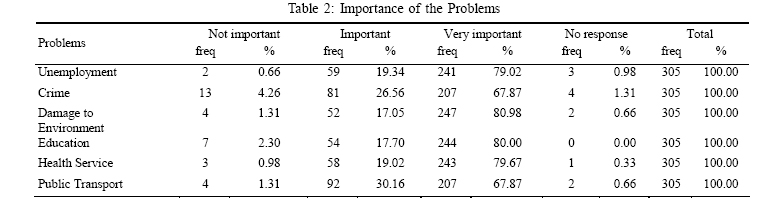
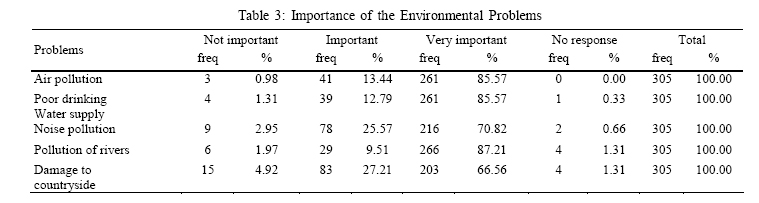
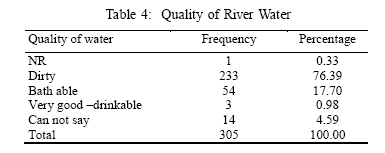
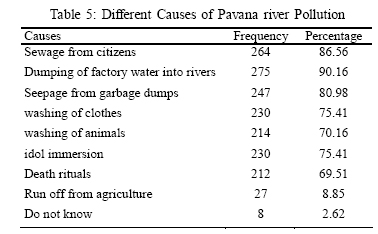
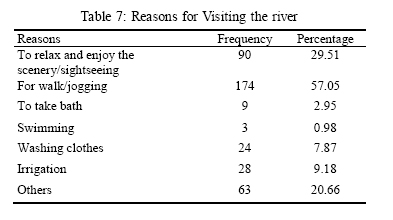
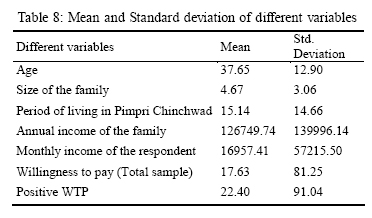
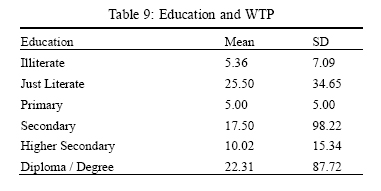
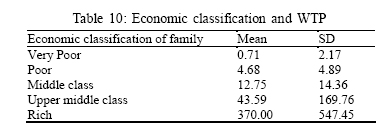
International Journal of Enviornmental Science and Technology, Vol. 4, No. 3, Summer 2007, pp. 401-408 Are people willing to pay for river water quality, contingent valuation 1*S. B. Imandoust; 2S. N. Gadam 1Department of Economic, Human Science Faculty, Payam Noor University, Mashhad, Iran Received 2 May 2006; Code Number: st07051 ABSTRACT Now a day's water pollution has caused incoveriences for people whom live near the Pavana river in Pune city, India. The river water quality has deteriorated by major water quality parameters like dissolved oxygen (DO), biological oxygen demand (BOD) and phosphates level. In present study it is tried to find people's willingness to pay (WTP) for improvement of river water quality. Contingent valuation method (CVM) was utilized for valuation of river water quality in Pavana river. Five categories of users have been chosen and then interviewed: households, farmers, fishermen, washing clothes women, bath taking people. One kilometer from each side of river was covered by researchers for sampling. Mean of willingness to pay was estimated at Rs 17.6 (45 Indian Rupees=$ 1) per family per month. This research shows CVM applicablity and the importance of river quality for Pune city and can effectively be used in developing countries. Keywords: Environmental economics, contingent valuation, willingness to pay, water pollution INTRUDUCTIONThe Mula, Mutha and Pavana rivers, flowing through the Pune City and Pmpri-Chinchwad industrial area, are grossly polluted with untreated domestic sewage and partially untreated industrial waste. The city is under continuous stress due to population growth, industrial growth and waste generation. The river water quality has deteriorated with respect to some of major water quality parameters like Dissolved Oxygen (DO), Biological Oxygen Demand (BOD) and phosphates levels. In account of Maharashtra Pollution Control Board (MPCB), all the pollution parameters are above permissible limits in Pune rivers. Water pollution is caused mainly by the discharge of untreated or inadequately treated sewage, industrial effluent and waste-water runoff from households. The absence or deficiency of sewage and refuse collection services causes water courses to become grossly polluted. Polluted water can spread diseases amongst people who use it for washing, cooking or bathing. There is the risk of contamination to ground water, water supplies from wells and agricultural users. Water pollution has its most immediate effect on human health, through water borne diseases. From economical point of view, water pollution is a negative externality which decreases economic welfare or consumer utility. For example, people living near the Pune rivers suffer from bad odor, mosquito and other problems. In fact, everybody who polluted the rivers imposes some economic cost to other people. It is difficult to measure the effect of pollution on people's life and translating this effect to money, because for environmental goods, we do not have market. The rise in pollution in Pune rivers is due to growth in population and industries. Pune city has grown at moderate rates in the postindependence period from 2.2% to 3.5% per annum over the last four decades. In 1981, the population of Pune was 13,80,395 souls which has gone upto 15,60,000 souls in 1999 and according to 2001 census, the population of Pune city has reached the level of 26,40,000 souls. The city had growth rate of about 60 per cent during the decade 1991- 2001. The population of Pune City and Pimpri-Chinchwad together was 40, 00,000 in 2001. With such high rate of growth in population, the discharge of domestic sewage into Mula, Mutha and Pavana rivers has gradually increased. But it is felt that quality of water in Pune rivers should be improved. Unfortunately all the three rivers are highly polluted with untreated domestic sewage and industrial effluents. Now-a-days one of the important factors in environmental economics is the pollution problem in the industrial city. Presently, Pune is the seventh ranking industrial metropolis in India. There were 1,473 industrial units in 1972 in Pune which reached to 4,527 by 1984 and 5,838 in 1995 (Nagarkar, 1997) and more than 6195 only in industrial area (District Census, 2002). Rivers are national asset and have great economic value, thus we must protect them. Most of the industrial units are in Pimpri-Chinchwad and on the banks of Pavana river. With over 4,000 industrial units in the large, medium and small sectors dotting its landscape, the sprawling Pimpri-Chinchwad industrial belt is one of the largest of its kind in this part of the country and certainly boasts of some of the biggest names in the industry. Take a look at the names that, it is home to Tata Engineering, Bajaj Auto, Hindustan Antibiotic, The Finolex Group of Industries and a clutch of Swedish companies that made this twin city their home in the mid-sixties including Sandvik Asia and Atlas Copco. Fortunately during last decade, World Bank and other organizations have done valuable research in different parts of India. One of the best studies have been ever found by researchers was about Ganga river, (Markandeya, et al., 2000). It was very useful for the researchers. It was not found any environmental economic study about Pune metropolitan region. Although many studies have been conducted about environmental pollution in Pune rivers, the economic aspect was not considered. Although in other countries some valuable Contingent Valuation Method (CVM) studies have been done, for example Mourato had computed value of water quality improvement for biggest lake in Europe, lake Balaton (Mourato, 1997). Georgiou had combined contingent ranking and contingent valuation study, for valuation of river water quality (Georgiou et al., 2000). Soutukorva computed the value of water quality by a random utility model of recreation in the Stockholm Archipelago. He examined how an improved water quality affects the demand for recreation in the Stockholm Archipelago (Soutukorva, 2001). Soderquist had utilized another method for a reduced entrophication in the Stockholm archipelago. The benefits of reduced eutrophication effects in Stockholm, Sweden, were estimated by application of contingent valuation method (Soderquist, 2000). All these researches were very useful for researchers. The paper is organized as follows. The materials and methods are summarized in section 2. Section 3 presents general empirical results. Section 4 provides some concluding remarks and recommendations. MATERIALS AND METHODSFrom historical point of view, initial societies established near the water resource. So, many countries have a challenge because of water or water share of common rivers. For finding problems, rivers were visited, especially in industrial area of Pimpri-Chinchwad. It was observed that industrial effluent and domestic sewage contaminate Pavana river. Many people werewashingclothes and somepeople washing animals. Also slum areas near the river were seen, they used bank of the river for toilet. One km from each bank of river was considered. In this stretch, river flows passing through the city. Researchers took decision to interview all kinds of people. Everybody, poor, rich, educated and uneducated participated in our study. Thus, slum areas were covered as well as other housing societies. Then respondents were categorized as follow: 1. Households; 2. Fishermen; 3. People taking bath in the river; 4. Dhobi Ghat people (who use the river water for washing clothes); and 5. Farmers For sampling, most of the societies along the river have been visited, choosing randomly. All societies and slum areas near the river participated in our sampling. It was tried to interview the head of the family and if head of the family was not available the housewives or other knowledgeable members were interviewed . The researchers conducted interview with the help of assistant especially when the respondents could not speak English. The locations of the respondents are listed in Table 1. Socio-economic details First section of the questionnaire collected information on socio-economic variables to be used in the regression estimation of the valuation function. Apart from the name of the respondent and the address, information was collected on age, sex, occupation, education and family members. Because people are sensitive about disclosing their income, the income question was brought at the end of questionnaire. For finding the real economic situation, families were classified to five categories (very poor, poor, middle class, upper middle class and rich). In the second part of questionnaire, some questions were designed about environmental problems, quality of water in Pavana, causes of pollution,NGO's andmunicipal policy about the river and the end of this section carried questions designed to make the respondent think about the river pollution and his /her responsibility towards action to clean the river. Value elicitation Value elicitation was the most crucial section of the questionnaire. First the Pavana Action Plan was described for improving river quality and then in order to tackle the part of problem, the respondents were given examples of private goods to illustrate the link between willingness-to -pay (W.T.P.) for benefits received (for example, we are willing to pay Rs 'X' for a pen because we expect at least Rs 'X' worth of benefits in return). Once this was done, the “missing market” characteristic of the good water quality was explained, which made its valuation possible only by directly asking the respondents what value they would place on the benefits they received. So open ended question was utilized in this section. The payment vehicle In the pre-testing step, three payment vehicles have been introduced. After they mentioned W.T.Ptheywere asked, “to whom you want to pay?” Most of people replied “to P.C.M.C” (Pimpri-Chinchwad Municipal Corporation), but some people replied as 'Charitable Trust' and some replied as 'NGO. Thus, municipal taxes were chosen. For obtaining better results, payment card and open-ended format were combined for W.T.P. question. Moreover, special questions were designed for fishermen, farmers, Washing cloth people and bath taking people, and attached them to the main questionnaire. Hedonic price method can be used for value of environment that is nearby a house. If one flat is situated near a garden with good climate, it is more expensive than some other flat in the poor environmental conditions. Difference between the prices of these two flats shows us the environmental value. Since this is quite commonly used method, the researcher studied it in depth. Since, as yet, there is no spot environmentally well developed on river Pavana, such study of differential prices of flats was not possible. Therefore, contingent valuation method has been chosen. Moreover, the Hedonic price method only calculates direct use value, while contingent valuation method estimates both direct and indirect use values. In contingent valuation, we asked people as to how much theyare willingto pay for utilizing better quality of environmental goods. CVM is one of the most popular methods for environmental valuation. It was used in developing countries as well as developed countries. When market data is not available this method can be used. RESULTSData and information collection was carried out by in person interview of local residents in the Pimpri-Chinchwad area. Respondents were interviewed at their residence and interviews were undertaken over the period from December 2004 to January 2005. Table 2 shows the importance of the social problems in the city. It had four options (not important, important, very important and no response). Interestingly, damage to environment was very important for about 81 percent of people, and it was higher than other problems like education, health service, unemployment, public transport and crime. Among environmental problems, pollution of rivers obtained highest percentage (87 %) for 'very important option'. Air pollution, poor drinking water supply, noise pollution and damage to countryside also were very important for most of the respondents. Table 3 shows the details. As it was expected, quality of river water has been evaluated as 'Dirty' by 76% of respondents, only about 18 percent thought it is bathable and less than one percent told us it is drinkable, Table 4 presents the data. Discharge of factory wastewater, municipal sewage, seepage from garbage dumps, idol immersion and washing clothes or animals were different causes of Pavana river pollution as can be seen from Table 5. Table 6 and Table 7 show the main reasons for people to visit the river, along with the percentage of those who have visited the river area, as well as of the total sample, who stated the reason as to why they visited the river. Not surprisingly, more than 97 percent of respondents thought having the river in the city is useful; only less than 3 percent told us it is useless. As it was mentioned 305 persons were interviewed. Out of the sample, 63 percent were male, 37 per cent females. Average age of respondents was 37.65 and mean for period of living in the Pimpri-Chinchwad area were calculated 15.14 years. People were asked whether they were willing to pay (W.T.P.) some money and get river clean (up to swimming level). Profile of the study area Table 8 shows mean and standard deviation for some important variables. Table 9 demonstrates mean and standard deviation for various education groups. Mean of WTP for illiterate respondent was Rs. 5.36 while for educated people (university/diploma degree) was Rs. 22.31. As was mentioned in the previous section total average WTP is 17.55. Mean and S.D. of WTP for different economic classification is presented in Table 10. As it was expected mean of WTP for very poor was below Rupee 1 while for rich people was Rs. 370. These results are completely consistent with economic theory and are a good witness of validity of research. User benefits for pavana river As it was mentioned, the mean of WTP for all user was 17.73 Rs. per family per month. In account of latest data, population of Pimpri-Chinchwad was 10,06,417 in the 170 sq. km. area. Markandeya and Murty (2000) Thus, density can be estimated as follows.
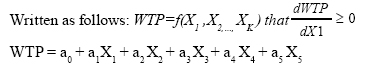
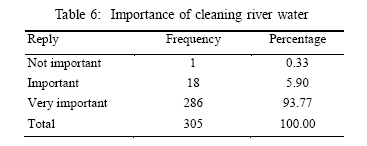
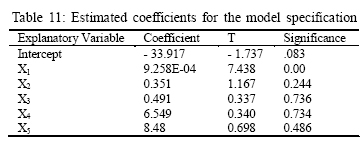
Pavana length is 11.5 km inside the city. So total sampling area is 23 sq. KM (11.5 x 2). Total user population can be estimated easily. 23 x (5920) = 1, 36,160 total user population As per of Census 2001, household size is 4.9; therefore total families in our case can be calculated as below: 1, 36,160 / 4.9 = 27,787.7 households If we multiply this to Rs. 17.73 aggregate monthly benefits will emerge. Then yearly amount also will be. 17.73 x (27,787.7) = 4,92,676. Total WTP per month 4, 92,676 x 12 = 59, 12,122 is total user benefit per year. As can be seen from above total user benefit per year is about Rs. 59 lakhs (Rs 5,900,000 and Ropee 46= $ 1). It is approximately equal 128, US $ 261 , per year. WTP bid function analysis Analysis of bid function underlying the WTP responses was undertaken, with a range of explanatory variables being investigated. Linear and long functional forms were tested. The former seemed to perform better in terms of the statistical significance of regression coefficient; hence, the linear functional form was reported here. Since this provides for ease in interpretation, Bid function can be written as follows: WTP = a0 + a1X1 + a2 X2 +…+ aK XK Where the X1 + X2 … Xk are the values taken by the K factors that the analyst believes mayinfluence the WTP change experienced by the respondents. The K coefficients a0 a1 …aK measure the impact of each of the factors on the change in WTP Thus, WTP is a dependent variable. Explanatory variables are as follows: X1 = per capita annual income of the family X2 = period of living in Pimpri - Chinchwad X3 = Size ofthe family X4 = importance of cleaning river water (Dummy: 1 if very important; zero otherwise) X5 = number of visitors to Pavana river side. (Dummy: 1 if visit daily; zero otherwise) So we can write WTP function as follow: : Estimated coefficients for the model specification found to have the 'best' fit of the self explanatory variables with the most statistically significant comes as Table 11. Dependent Variables: WTP, number of observation = 304, F = 11.4545, R2 = 0.161, Adj R2 = 0.147. The dependent variable used is WTP (per family Rs. per month) for Pavana Action Plan. All samples were included for the WTP amounts, whilst the overall model is found to be statistically significant (F=11.4). Its explanatory power is low around 16 % of the variation in WTP being explained by the explanatory variables. Firstly, levels of explanatory power are notoriously low for such contingent valuation method values. Usually if R2 will be bigger than 10 percent, the model would be acceptable. But important variable in this type of CVM study is 'Income', fortunately in our model; income has positive relationship with WTP and is statisticallysignificant. It provesvalidityand reliability of research. DISCUSSION AND CONCLUSION One of the important concepts that should be considered especially about rivers is 'absorptive capacity''. It is also known as assimilative capacity, the ability of the environment (rivers) to assimilate waste products from the economy. If amount of waste water into the river exceeds the absorptive capacity, the quality of river water will decrease. The researchers believes that for Pune rivers amount of discharge is more than assimilative capacity. The economic and social costs of environmental damage are usually divided into three broad categories; health costs, productivity costs, and the loss of environmental quality. The economic value of these costs can be estimated using valuation methods. Environmental economics is concerned with the impact of economy on the environment, the significance of the environment to the economy, and the appropriate way of regulating economic activity. Nowadays this field is given attention in most of the countries. For valuing the improvement in environment we have different methods. The researchers utilized 'Stated Preferences' method. After receivingall methods, CVM was chosen for the present study. Many CVM research were found in different countries, but only a few studies have been carried out in India applying CVM. As far as the application of CVM for river pollution is concerned, the researchers found only one study on Ganga river. No such study was available in respect of any other river. As far as the study of rivers is concerned, the rivers like Ganges and smaller rivers like Pavana, Mula and Mutha need different approach, while applying CV method. During last two decades Pune had rapid population and industrial growth. The latest data (2002) shows that 6,195 industrial units are working in PCMC area. They are classified as:
Most of small scale industries do not have ETP. According to the standard guidelines for different parameters, pollution in Pune rivers has been increasing during last 15 years. In most of the spots, the river water is classified as Type A4 indicating that the water is not fit for any use. The PCMC had taken water samples from different industrial stream. The analysis showed that 20 samples out of 35 were acidic, while 5 samples had alkaline status. 13 samples had oil and grease contents more than 10 mg/L other factors like BOD and COD were also more than 'A4' standard for some samples. On the basis of our survey, it was found that river pollution is very important for most of people (more than 87 % respondents in this study). About 76 % of respondents evaluated Pavana river as a “Dirty river''. At the same time, it was observed that some poor people have positive WTP while some rich people were not ready to pay any money for improving water quality in Pavana. Mean of WTP for rich people was Rs. 370 while for poor Rs. 4.68 and for very poor it was Rs. 0. 71. For whole sample, mean of WTP was Rs. 17.55 per family, per month. As expected WTP and education have strong relationship. For example mean of WTP for illiterate people was Rs. 5.36 while for educated people (Diploma/ University Degree) was Rs. 22.31. It can also prove validity of present study. As it was expected more than 89 percent believed that industrial growth in PMR has increased river pollution. About municipal policy, 26 % believed that PCMC had good performance for reducing pollution in Pavana while 55 % thought in opposition to this. Some suggestions were presented for cleaning river which most of people were agree with these suggestions. People were requested whether they want to participate in 'Pavana Action Plan' for improving water quality. More than 78 percent replied positively. It proves that people really like Pavana river. About 85 percent respondents worried about the presence of toxic chemicalsin Pavana river. BOD and CODinPavana and industrial canals (nallahs) are more than acceptable standards. Researcher himself directly saw green effluents that were flowing in nallahs. Among the people who directly use Pavana river, farmers were more co-operative for cleaning the river. Average willingness to pay for whole sample is Rs. 17.55 per month per family. If protest bid and zero WTP delete, mean of WTP will increase to Rs. 22.40 per family per month. As reported by the fishermen interviewed, fish catch has decreased due to pollution in Pavana river. Farmers told researchers that they can not produce some crops due to water pollution. When researchers visited different spots of river and was interviewing people so many of respondents complained about industrial pollution. Especially fishermen and farmers were affected by water pollution. More than 75 percent of respondents expressed that the factors of causing pollution in river are sewage from citizens, dumping of factory wastage, washing clothes and idol immersion. Regression WTP bid function was significant for overall model (F=11.4). Explanatory power was low, but it is more than other similar cases. Coefficient of income in regression model was positive and statistically significant. This is consistent with economic theory. Aggregate WTP for all users of Pavana was estimated at about Rs. 59 Lakhs per year. For improving river quality many works should be done. Some of the recommendations are as follows: Public awareness especially among slum-dwellers should be done by PCMC and NGOs. For example, erecting some boards with motto “Keep our River Clean''. It seems younger and more educated people can play major role for this propose. Municipal should monitor industrial effluents and the permits or 'No Objection' certificates production should not be issued for industrial units polluting the river water. The researchers visited Nalla (canal) Park in PCMC area. Nalla water was not useable for gardening especially in Premlok Park. Small treatment plants were suggested for cleaning the nalla water; and entrance fee of Rs. 2/per person can be charged. Entrance fee is very common in Indian parks. Most of the farmers are willing to pay money as per government's rules. They will co-operate with PCMC if water quality of Pavana river is improved. They will gain more than other users because they take river water for irrigation .Some place with small treatment plant and pipe water should be made available to dhobis (washing cloths). At least one place for holy bath should be constructed. It should be done by means of a small diversion from the river, near Morya Temple. Diverted water stream should be kept open for bathing and the outlet of this diversion stream should be to a small treatment plant. Fortunately most of respondents trust municipal and if they see some progress in cleaning river process; people's participation in the scheme will increase. Moreover NGOs should be supported by government. Some people prefer to help NGOs or charitable institutions for cleaning of the river. REFERENCES
© 2007 Center for Environment and Energy Research and Studies (CEERS) The following images related to this document are available:Photo images[st07051t1.jpg] [st07051t4.jpg] [st07051t2.jpg] [st07051t3.jpg] [st07051t11.jpg] [st07051t8.jpg] [st07051t10.jpg] [st07051t6.jpg] [st07051t9.jpg] [st07051t7.jpg] [st07051t5.jpg] |
| |||||||||
