 |
| About Bioline | All Journals | Testimonials | Membership | News |
|
||||||
|
||||||
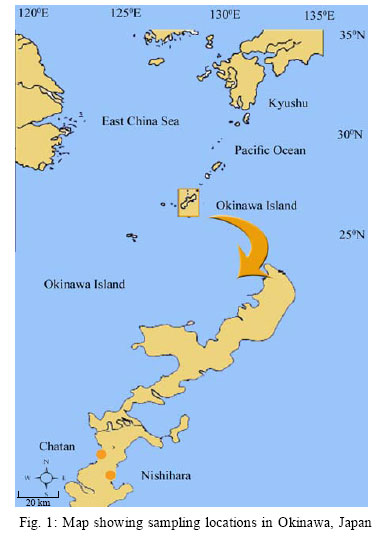
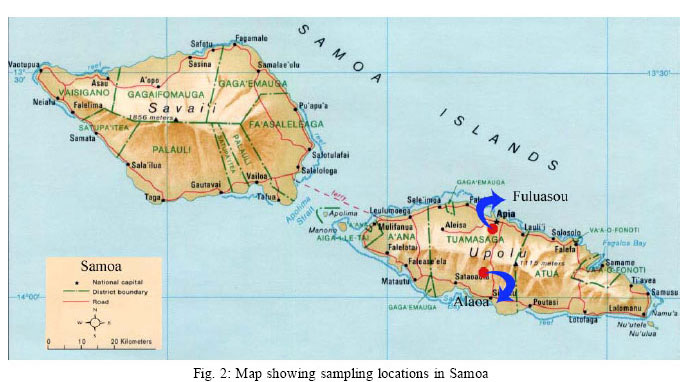
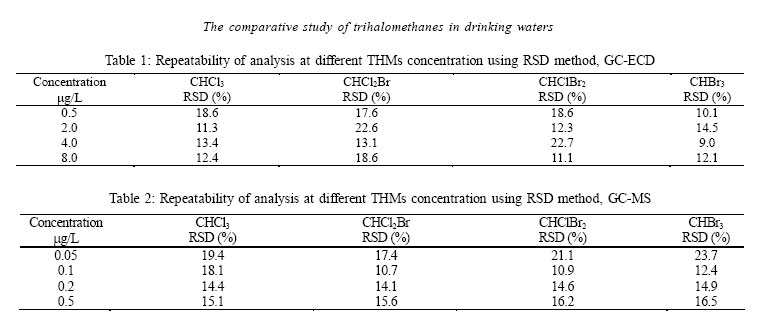
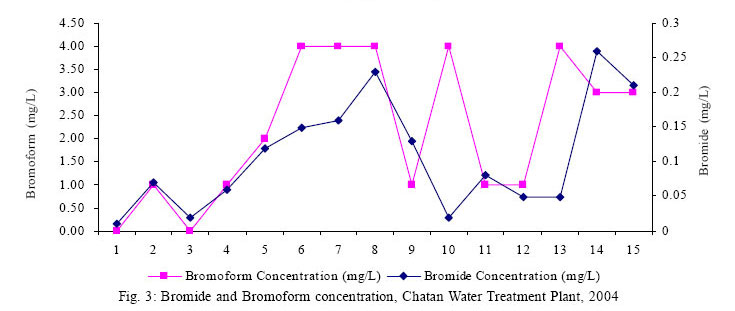
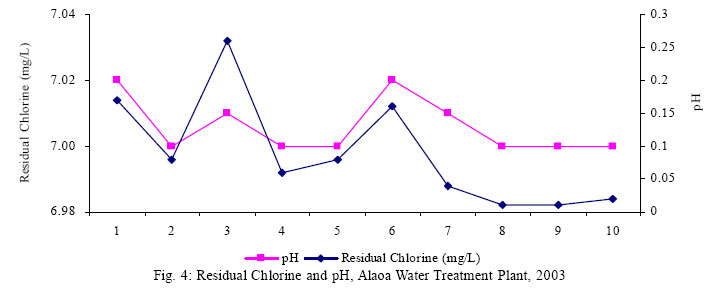
International Journal of Enviornmental Science and Technology, Vol. 4, No. 4, Autumn 2007, pp.421-426 The comparative study of trihalomethanes in drinking water 1*T. S. Imo; 2T. Oomori; 3M. Toshihiko; 3F. Tamaki 1Graduate School of Engineering and Science, Faculty of Science, University of the Ryukyus, Senbaru 1, Nishihara-cho, Okinawa 903-213, Japan *Corresponding Author Email: k058557@eve.u-ryukyu.ac.jp Tel./Fax: +8190 5742 8098 Received 5 April 2007; revised 20 June 2007; accepted 20 August 2007; available online 1 September 2007 Code Number :st07054 ABSTRACT The purpose of this study was to assess exposure of four trihalomethanes (chloroform, bromodichloromethane, dibromochloromethane and bromoform) in drinking waters of Okinawa Island and Samoa. Trihalomethanes compounds were determined in the drinking water samples that were collected from the selected consumption sites and treatment plants of both Okinawa and Samoa in 2003-2004. The Chatan and Nishihara Water Treatment Plants (Okinawa) uses both ozonation and chlorination for primary and secondary disinfection. For Samoa Water Treatment Plants only chlorination is used as primary disinfection. Results showed that the mean concentration of trihalomethanes from treatment plants in Okinawa ranged from 0.30 ± 1.81 µg/L to 11 ± 2.68 µg/L and from the consumption sites ranged from 2.08 ± 0.32 µg/L to 19.39 ± 100 µg/L. In comparison, the mean concentration of trihalomethanes from the treatment plants in Samoa ranged from 226 ± 81.2 µg/L to 267 ± 92.3 µg/L and from the consumption sites were in the ranges 212 ± 101 µg/L to 387 ± 125 µg/L. Brominated compounds were commonly seen in all samples collected in Okinawa. Among the trihalomethanes compounds, chloroform was the common detected trihalomethanes in the samples collected from Samoa. The trihalomethanes levels in all samples collected in Okinawa and Samoa were generally below the guideline values in Japan, but some samples displayed levels which exceeded the level of Japan Water Quality and WHO Standards for chlorinated and brominated compounds. Key words: Trihalomethanes, drinking water, water, quality INTRODUCTIONDrinking water is supplied via surface and groundwater resources all around the world (Dastanaie, et al., 2007). These surface and groundwater always contains dissolved and suspended substances of organic and mineral origin (Jain, et al., 2006). Disinfectants such as chlorine are used in drinking water to protect the public from pathogenic microorganisms, but have been reported to form trihalomethanes (THMs), (Calderon, 2000) which are suspected to be human carcinogens. Rook (1974) discovered that THMs are a group of compounds that formed when chlorine used to disinfect drinking water, reacts with naturally occurring organic matter such as decaying leaves and vegetation. The THMs formed in this way are chloroform (CHCl3), bromodichloromethane (CHBrCl2), dibromo-chloromethane (CHBr2Cl) and bromoform (CHBr3), (Cragle, et al., 1985; Bergamashi, et al., 1999). Even if no sources of human contamination exist in the formation of THMs there is potential for natural levels of other compounds to be harmful to human health. In several epidemiological studies, an association between the ingestion of chlorinated water and various cancers has been reported, including cancers of the esophagus, pancreas, urinary tract and stomach (Lange and Kawczynski, 1978). Past studies reveal that THMs receive a lot of attention because chloroform is known to be an animal carcinogen (Dodds, et al., 1999; Simpson and Hayes, 1998). Based on previous toxicological studies, acute toxic doses of chloroform can also cause central nervous system depression and cardiac effects (Gibbons and Laha, 1999). Lin (2000) conducted a study in South Taiwan and identified that exposure to THMs through ingestion was 47.9 µg/day, while exposure from inhalation resulting from showering and pre- and post-cooking activities accounted for 30.7µg/day. THM measurement assesses the four common THMs with chloroform usually constituting the largest proportion due to being the principal disinfection by-product in chlorinated drinking water (LeBel and Williams, 1995). Several chlorination studies have been conducted for THMs as mentioned above. However, this is the first investigation in Samoa related to the formation of a wide range of chlorination by-products including individual species of THMs. The results presented here provide more insight to the THMs concentration which is a necessary objective in minimizing the exposure to THMs in drinking water. MATERIALS AND METHODSSampling Sampling was conducted in 2003-2004 from selected treatment plants and consumption sites both Okinawa and Samoa as shown in Figs. 1 and 2. The samples for determination of trihalomethanes were collected in Okinawa in16th August, 2003, 24th April, 21st August, 14th October, 25th November, and 10th December, 2004. The samples from Samoa were collected in 22nd August and 20th December 2003. Sampling from treatmentplants and consumption sites were conducted simultaneously. Chatan (CTP) and Nishihara (NTP) water treatment plants were selected for this study because they distributed water to the most populated city (Urasoe, Ginowan) areas in Okinawa. Fuluasou (FTP) and Alaoa (ATP) treatment plants were selected from Samoa which they also distributed water to the urban areas. The consumption sites from cities (Okinawa) and urban areas (Samoa) were selected for this study. Either ozonation and chlorination or combinations thereof were the two techniques for disinfection of drinking water in all treatment plants in Okinawa and Samoa. Duplicate tap water and raw water samples were collected in 500 mL amber volume glass bottles previously cleaned with acetone and large volume of distilled water and then dried for 2 h. at 100 °C. The bottles were firstlywashed with sample water or tap water andthen completely filled with water samples so that no headspace was left in them. Samples were preserved by acidification with 6N/ 40 mLof HCl and with 0.5 g ofAscorbic acid (C6H8O6) (APHA, 2003) added due to samples that contains residual. Much care was taken with glassware cleanup to avoid contamination. After sampling, all samples were stored in the dark at the temperature between 0 °C and 4 °C before analysis. The samples from Samoa were transported to Japan immediately after sampling. Analytical procedure According to the Standard Methods all samples were analyzed based on the described procedures in APHA Standard Methods (APHA, 2003). Based on the direct aqueous injection, a Shimadzu QP-5000 series, GC high performance quadrupole mass spectrometer (GC-MS) using a Static Headspace technique was used for the identification and quantification of THMs. The MS was paired with a GC-17A gas chromatograph with a DB 624 Capillary column of 60 m, 0.32 mm i.d (internal diameter) and film thickness of 1.8 mm. The oven temperature was maintained at 150 °C. The conditions are finally adopted both in the computer (GC-MS solution software, version 1.1) and GC controller panel. Basic parameters such as temperature (mercury thermometer), pH (HACH EC30 pH meter and Hitachi-Horiba F-12 type pH meter) were monitored at the time of the THMs samples were collected except bromide concentration (ion chromatography; Dionex DX-500 and total organic carbon was analyzed using a carbon analyzer 5000A was analyzed at the laboratory. Quality control The analytical quality controlled procedures including the analyses of THMs standards (RPA method), internal standard (4-bromofluorobenzene, 1% (v/v), reagent water and Stock Standard solution of individual THMs in Grade, Kanto Chemical Co. Inc, Tokyo and duplicate analysis of samples from each sampling sites which shows good recoveries. The mean recoveries of THMs ranged from 70 % and 105 %. The detection limit of (CHCl3), (CHBrCl2), (CHBr2Cl) and (CHBr3) were 0.20, 0.05, 0.05 and 0.10 µg/L. Repeatability of analysis at different THMs concentration using relative standard deviation method from GC-ECD and GC-MS are shown in Tables 1 and 2. All solvents used were of pesticides analysis grade. RESULTSIn the NTP, the THMs concentration was 8.2 µg/L in the pre-chlorination and approached zero in the post-chlorination point. It was observed that before distribution, THMs concentration was 1.2 µg/L. In the CTP, the THMs concentration in the pre-chlorination point was 11 µg/L. In the post-chlorination point, the THMs concentration was 0.3 µg/L. In the ozonation process, THMs concentration approached zero. The THMs concentration before distribution point was observed to be 0.6 µg/L. In the consumption sites that also received water from CTP, the THMs concentration ranged from 5.66 µg/L to 18.41 µg/L. The bromoform compounds were higher in the consumption sites. In Urasoe City the THMs concentration ranged from 5.27 mg/L to 8.61 mg/L. For Ginowan City, the THMs concentration ranged from 6.44 µg/L to 13.83 µg/L. In Naha city, the THMs concentration ranged from 2.68 µg/L to 12.26 µg/L. Compared it with THMs concentration in Hyogo Prefecture (Kawamoto and Makihata, 2004), the chloroform concentration in this study are lower compared with THMs concentration in Hyogo Prefecture. Indicating the values were well below the compliance level of 100 µg/L. Many Researchers have observed the presence of bromide increases theyieldTHMs (Golfinopoulos, 2000,Aizawa, et al., 1989). Brominated compounds were commonly seen in all samples. Some samples predominately chloroform with little brominated compounds. This was more commonly seen with source water that is near the sea or had been desalinated. Fig. 3 shows Bromide ion since it has the highest bromoform concentration apart from other sites. In comparison, ATP (Samoa) showed a high concentration of THMs apart from other treatment plants. Levels of THMs increases as the chlorinated water moves from the water treatment plant through the distribution system, because of the chlorinated presence of chlorine residual. It is seen that chloroform compound werehigh inall treatment plantsbut(CHBrCl2), (CHBr2Cl) and (CHBr3)concentrations rangedfrom 4 mg/L- 48 µg/ L. For consumption sites, the concentration ranged from 24 µg/L- 74.5 µg/L. Most of the treatment plants received its water sources from rivers. Levels of chloroform, the most common THMs are generally higher in treated water originating from surface water rather than groundwater, maybe because of higher organic matter in the former. The river water including high concentrations of organic matter due to vegetation and the warm temperature of the area all through out the year may also be a contributing factor. To begin to understand why there was a large range of chlorinated compounds and their effect on finished water TTHMs (Total THMs) concentrations, characteristics of treated water were analyzed. The first step was to quantify the chloride ion in the drinking water; pH and residual chlorine was also measured in all samples. Fig. 4 shows chloride concentrations from ATP. The ATP and FTP are located inland assuming the increasing formation of organic matter due to vegetation. DISCUSSION AND CONCLUSIONThe extent of formation of THMs varies with different water treatment processes. THMs compounds were detected in all water samples, after chlorination and ozonation point were collected from the treatment plants and from the consumption sites. No trihalomethanes were detected in raw water samples. The concentrations of trihalomethanes compounds varied among the treatment plants. NTP showed a high concentration of THMs after chlorination and before distribution point in the treatment plant. Levels of THMs are generally higher in treated water originating from surface water rather than groundwater because of the higher organic matter in the former (Lantagne, 2000; Okinawa Enterprise Bureau, 2001). Levels of THMs can increase as the chlorinated water moves from the water treatment plant through the distribution system, because of the continued presences of a chlorine residual (Golfinopoulos, et al., 1998; 2000). Among the four THMs compounds, bromoform has the highest concentration in all samples. The role of the bromide ion in the formation of THMs is critical. Without the bromide in the raw water, the three brominated THMs are not formed (Aizawa, et al., 1989). Bromide itself is a naturally occurring ion formed most commonly in ocean water near the ocean (Ishihanshi, et al., 1999). The occurrence of trihalomethanes in the drinking water in Okinawa and Samoa was studied in the treatment plants, NTP, CTP, the cities of Naha, Ginowan and Urasoe consumption sites (Okinawa) and ATP, FTP and its consumption sites (Samoa). The mean concentration of THMs from the two treatment plants in Okinawa ranged from 0.30 ± 1.81 µg/L to 11 ± 2.68 µg/L. The mean concentration of THMs from consumption sites ranged from 2.08 ± 0.32 µg/L to 19.39 ± 9.54 µg/L. In comparison, the mean concentration of THMs from the two treatment plants in Samoa ranged from 16 ± 21.2 µg/L to 32 ± 26.3 µg/L. The mean concentration of THMs in consumption sites ranged from 41 ± 31.4 µg/L to 68.7 ± 35 µg/L. ACKNOWLEDGEMENTSThis studywasfunded by the grantfrom the Ministry of Education, Culture, Sports, Science and Technology of Japan. Authors indebted to Professor Akira Tokuyama, Professor Akira Tanahara and Professor Takemitsu Arakaki for commenting on this study. To Mr. Kupa Latu manager of Samoa Water Authority at the time for the support in the provision of the Water Quality Data Report for Samoa. Authors would also wish to thank Dean Seuoti and Wang Xiao Chun for their help during the sampling. REFERENCES
© 2007 Center for Environment and Energy Research and Studies (CEERS) The following images related to this document are available:Photo images[st07054f2.jpg] [st07054t1.jpg] [st07054f3.jpg] [st07054f4.jpg] [st07054f1.jpg] |
| |||||||||
