 |
| About Bioline | All Journals | Testimonials | Membership | News |
|
||||||
|
||||||
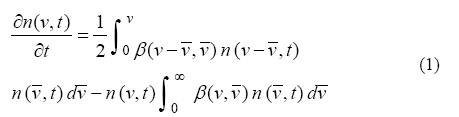
International Journal of Enviornmental Science and Technology, Vol. 5, No. 1, Winter 2008, pp. 1-10 Modeling study of the effects of the coagulation kernel with van der Waals forces and turbulence on the particle size distribution *S. Cho; D. V. Michelangeli Department of Earth and Space Science and Center of Atmospheric Chemistry, York University, 4700Keele Street, Toronto, Ontario, M3J 1P3, Canada Received 14 August 2007; revised 8 September 2007; accepted 24 October 2007; available online 26 December 2007 Code Number: st08001 ABSTRACT In this study, variations in the size distributions due to different assumptions for the coagulation kernel are investigated. In order to evaluate how the coagulation kernel influences the form of the particle size distribution and to describe the process of the Brownian coagulation, the Brownian coagulation kernel, including the van der Waals forces, is compared with the most frequently used coagulation coefficients. Retardation should be considered for interparticle interactions for particles larger than 1µm radius. However, for particle sizes larger than 0.1 µm, the Brownian kernel is not dominant, so the retardation effect can be ignored. The inclusion of the van der Waals forces in the Brownian coagulation kernel caused a faster coagulation process in the small particle size range. Taking account of the turbulent coagulation kernel, the turbulent coagulation kernel becomes more important when the turbulent intensity is higher. The turbulent coagulation kernel affects the large particle size range and ignoring the turbulent coagulation kernel will lead to overestimation of particle number concentration in model simulation. The results of this study indicate that the inclusion of van der Waals forces or the turbulent coagulation kernel in the total coagulation kernel impacts on the modeled particle size distributions and total particle number concentration. Key words: Modeling study, coagulation, van der Waals forces, aerosol, coagulation kernel INTRODUCTION Aerosols in the atmosphere are recognized as being a major health concern as well as a cause of damage to vegetation, reduced visibility, interference with economic development and climate change. Therefore, more detailed studies of processes leading to their formation and evolution are necessary. Aerosols affect various scales such as local, regional and global scales. Aerosols originate from primary sources such as soil dust, sea salt and black carbon as well as secondary sources such as chemical transformation resulting from SO2, NOx emissions and volatile organic compounds. The secondary aerosols will be often formed within industrial plumes and downwind from industrial sites. Therefore, a numerical model is necessary to simulate the evolution of aerosols realistically from an anthropogenic source such as an industrial plume. To simulate aerosol formation and evolution accurately, models must include microphysical processes such as nucleation, condensation/evaporation, coagulation, sedimentation and the dynamical processes related to plume dispersion. Coagulation is a kinetic process in which two particles undergoing relative motion collide and fuse. For aerosols, thermal agitation (Brownian motion), gravitational sedimentation, turbulent motion and interparticle forces induce relative motion. In general, Brownian motion is important for small particle sizes (< 0.5 µm, radius), while differential fall velocities and turbulent motion affect particles larger than 0.5µm.The effects ofinterparticle charges aredominant for small particles (Fuchs, 1964). Kruis and Kusters, (1997) derived new equations for particle coagulation rates in turbulent fluid flow. Their research takes into account the effects of particle inertia and the difference in densities of the fluid and the particles in a gaseous or liquid system. The rate of coagulation depends on the coagulation coefficient. In dense industrial plumes, coagulation plays a key role in the evolution of aerosols because of the high particle concentrations emitted and the formation of new very small particles. To simulate changes in the size distribution of coagulating aerosols, modelers have developed a number of approaches that assume either a continuous size spectrum or discrete bins that vary in size (Turco, et al., 1979 a, b; Kim and Seinfeld, 1990). Turco, et al., (1979 a, b) derived a basic semi-implicit algorithm to describe aerosol coagulation with an assumed geometrically related size distribution and a volume ratio of size bins equal to two. In 1994, Jacobson and Turco further developed these coagulation equations to allow the volume ratio of the adjacent bins to approach unity and to simulate coagulation among any number of particle types, each containing any number of volume fraction components. The long-term goal of the study is to develop a plume gas-phase and microphysical model that will adequately simulate aerosol mass and size distributions. Simulating coagulation in a modeling study is important in order to decrease large particle numbers. In this study, the employed model, i.e. the plume aerosol microphysical (PAM) model, is based on communityaerosol and radiation model for atmospheres (CARMA) (Toon, et al., 1988) and it was newly further developed in order to study aerosol formation and evolution to analyze aerosol size distribution and to compare the model and observations under industrial plume conditions (Cho, 2005) in the PAM model. The PAM model considered three processes in the calculation of the coagulation kernel: (1) the Brownian coagulation kernel, calculated according to Fuchs’ (1964) interpolation formula, (2) the convective Brownian diffusion enhancement described by Pruppacher and Klett, (1997) and (3) the coagulation kernel for gravitational collection estimated by Ludlum, (1980). In this study, coagulation rates are computed using an efficient, stable and accurate semi-implicit algorithm originally developed by Turco, et al., (1979 a, b) and later generalized to variable size bins and multicomponent systems by Jacobson and Turco, (1994). Further details of coagulation kernel can be found in Jacobson, (1999). This study has updated the Cunningham slip correction factor using Allen and Raabe, (1985). Fuchs, (1964) theory did not account for interparticle forces, such as the van der Waals forces. Sceats, (1989) derived a method of determining the Brownian coagulation kernel which included the effect of van der Waals forces. Chan and Mozurkewich, (2001) developed an empirical equation based on the measurements (Chan and Mozurkewich, (2001). This study used Chan and Mozurkewich’s method to study the effect of van der Waals forces on the particle size distribution. To determine the effects of the turbulent kernel on the aerosol size distribution, Kruis and Kusters,(1997) method was also included in the model. The particle size distribution due to aerosol coagulation is governed by the following equation (Muller, 1928):
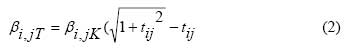
where, n ( v, t) is the particle size distribution as a function of time (t) and β(v, MATERIALS AND METHODS Brownian coagulation kernel and van der Waals forces Individual particles suspended in the air collide and stick together through various mechanisms including random Brownian motion of particles, differential settling velocities, flow turbulence and velocity gradients in laminar flow. Coagulation due to Brownian motion is an important particle growth mechanism in situations where small particles are at a high concentration or where the long-term behavior of suspended particles is of interest. The coagulation kernel and corresponding theories are well established for the free-molecule regime and the near-continuum plus continuum regimes. For several decades, many researchers (Schmdit-Ott and Burtscher, 1982; Alam, 1987; Sceats, 1989) have studied coagulation enhancement. Van der Waals forces which result from the interaction of fluctuating dipoles are known to have an influence on particle coagulation (Schmidt-Ott and Burtscher, 1982) and to increase the rate of aerosol coagulation (Alam, 1987). Due to their important role, the researchers added van der Waals forces to the present model as an enhancement factor to the Brownian coagulation kernel. To account for the effect of interparticle forces in the transition regime, the coagulation rate constant is given by Sceats, (1989) as follows:
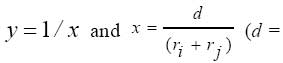
with
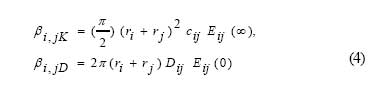
and
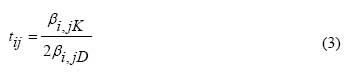
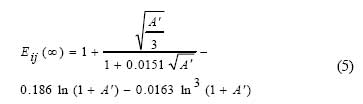
where, βi,jK and βi,jD are the coagulation rate constants for the free-molecular (i.e. kinetic) and diffusion (i.e. continuum) limited regimes, respectively. ri and rj are the radii of the two particles, cij is themean relative speed of the pair of particles, Dij is the relative diffusion coefficient of these particles (Dij = Di+ Dj). Eij (∞)ij (0) are the enhancement factors for van ∞ and Eder Waals interactions in the kinetic and diffusion limited regimes, respectively. The enhancement factor is a multiplying factor that is applied to the coagulation coefficient (Eq. 2) to account for the influence of van der Waals forces. Chan and Mozurkewich, (2001) derived the enhancement factors for van der Waals interactions in the free-molecule limit and the continuum limit, Eij (0) by obtaining a numerical approximation to fit theoretical values:
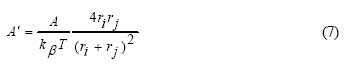
where, the reduced Hamaker constant ( A' ) is related to the Hamaker constant (A = 6×10-13 erg). In this study, it is assumed that the particle is composed of H2SO4/ H2O and the deduced Hamaker constant can be calculated as follows:
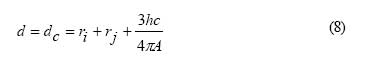
where, ri and ri are the radii of the two particles, kB is Boltzmann’s constant, T is air temperature and A is the Hamaker constant. A’ is valid up to 1000. If the particles are far apart, the finite speed of light must be accounted for in the van der Waals’ potential; this reduces the interparticle attractive force significantly. When this retardation is taken into account, the weaker potential at longer distances results in a reduction of the enhancement factor. A transition point between the retarded and nonretarded regions can be defined by Schmidt Ott and Burtscher, (1982):
where, h is Planck’s constant, c is the speed of light and A is theHamaker constant(A= 6×10-13 erg). In terms of the separation variable, xc becomes:
The interaction potential between the particles can be described as follows (Schmidt Ott and Burtscher, 1982):
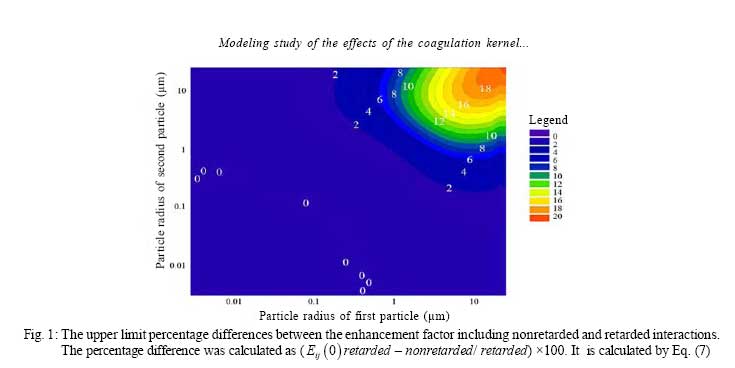
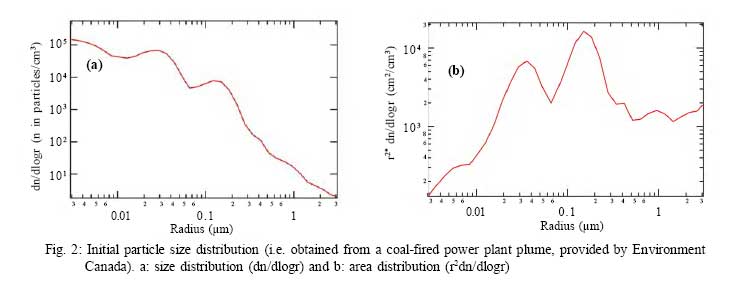
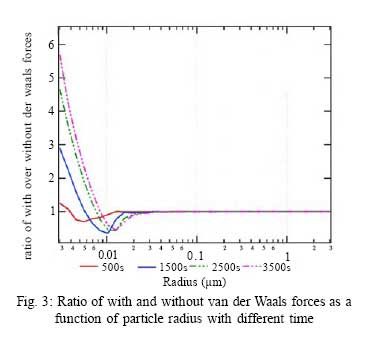
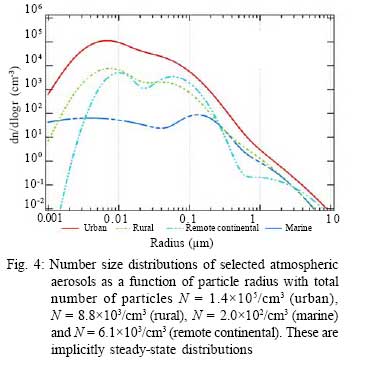
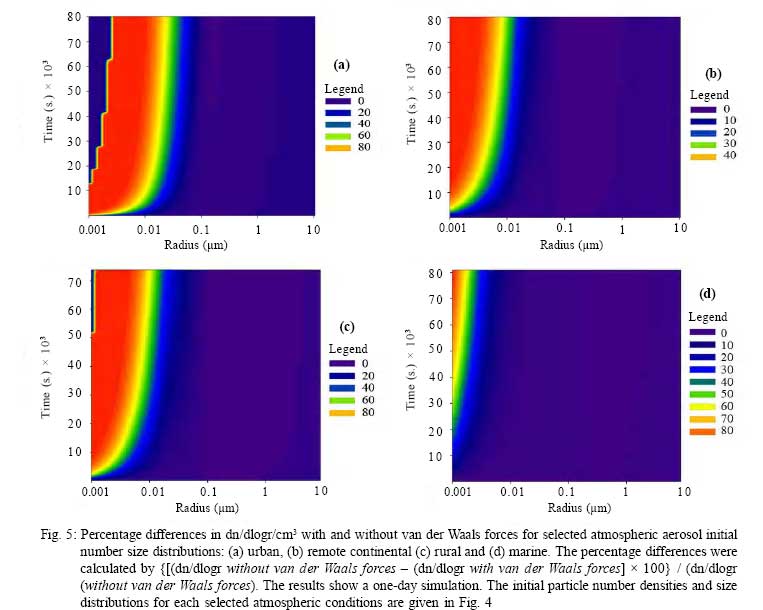
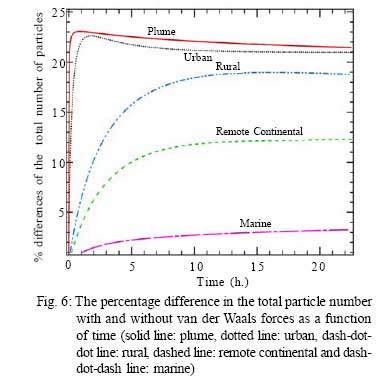
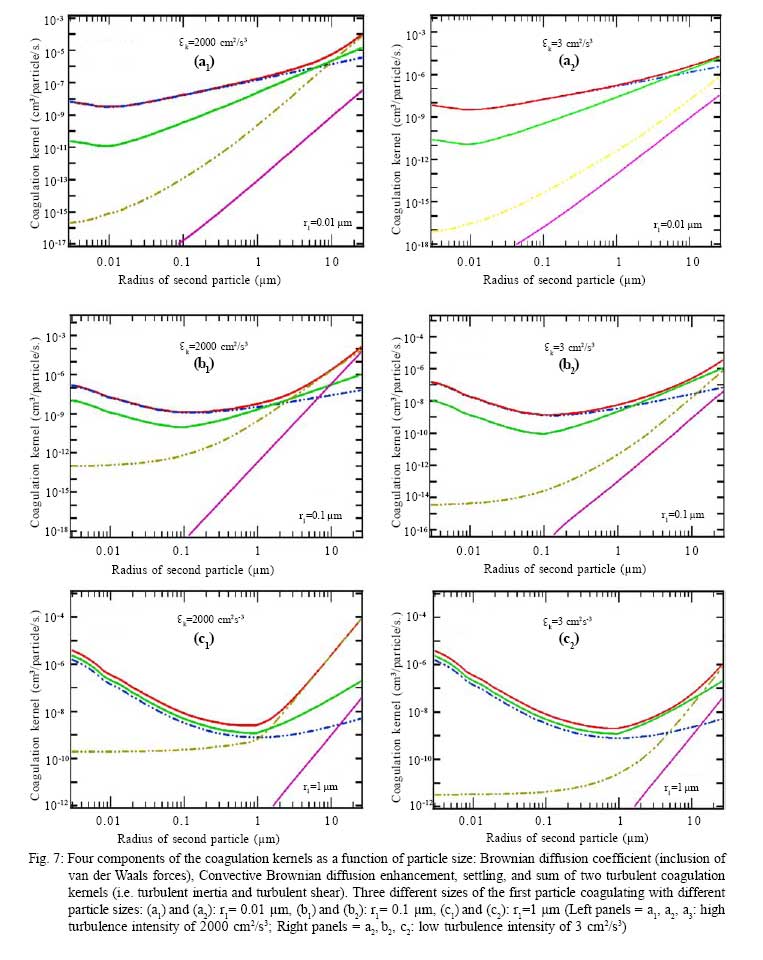
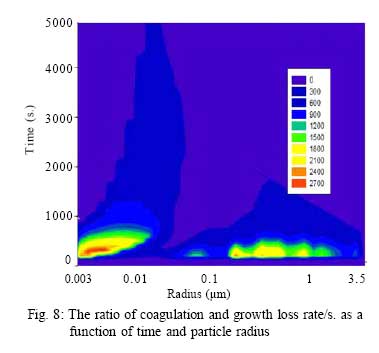
with In order to investigate the impact of van der Waals forces on the size distributions, a comparison was made between the results with those of the Fuchs Brownian coagulation kernel including and excluding van der Waals forces (based on Sceats, 1989; Eq. 2). The upper limit percentage differences between the enhancement factor including nonretarded and retarded interactions is shown in Fig. 1. Calculations for all combinations of particle sizes show that for parcels with radii of 100 µm or less, the upper limit of the effect of retardation is less than 20%. For particles with radii no lower than 0.5 µm, the upper limit is no more than 2%. Retardation may be important for particles greater than 1µm. However, for particle sizes larger than 0.1µm, the Brownian kernel is not dominant, so the retardation effect can be ignored. It were concluded that there is no need to include retardation in the models of aerosol coagulation. RESULTS AND DISCUSSION Impact of van der Waals forces on the size distribution in an industrial plume In order to investigate the importance of van der Waals forces on highly polluted air in an industrial plume, particle size distributions from a coal-fired power plant were used which were taken during the metals in the environment (MITE) 2000 field study. Fig. 2 a and b. Fig. 3 shows the effect of van der Waals forces on the size distribution of particles in an assumed plume. In Fig. 3, it were seen that for particles smaller than 0.02 µm, the inclusion of van der Waals forces results in a faster coagulation larger than 0.02 µm (the difference between with and without is almost negligible). This is because van der Waals forces are more important for smaller particle size and higher number concentration. The decrease in the total particle number and increases in particle sizes with time lead to a lesser effect of the van der Waals forces. The effect of van der Waals forces on different background initial size distributions This section investigates the effect of van der Waals forces on different background initial size distributions. Jaenicke, (1993) provided selected atmospheric aerosols size distributions for urban, rural, marine and remote continental as the sum of three lognormal functions (Fig. 4). The Brownian coagulation kernel is only considered in this following sensitivity study (Figs. 5 a-d). Figs. 5a to 5d illustrate the particle number densities of percentage differences between with and without van der Waals forces for four cases. All cases show that the largest percentage difference occurs with the smallest particles and the percentage differences increase with time. The fastest growth of the small particles occurs for the urban case because of their highest particle number density. Particles of radii less than 0.005 µm are all scavenged after 3 h. and 14 h. simulation time in urban and rural cases, respectively. Fig. 6 presents the percentage difference in the total number of particles, with and without van der Waals forces, as a function of time for the five-aerosol size distributions studied. The plume and urban cases show that the maximum percentage differences increased very rapidly after 3 s to 23.2% and 22.6%, respectively. Then it drops down gradually with time increasing. The percentage differences increase continuously to 18.7%, 12.3% and 3.2% for the rural, remote continental and marine cases, respectively. The highest percentage difference occurs in the plume case because the effect of van der Waals forces on particle evolution is stronger for higher particle number concentration. Furthermore, when van der Waals forces are included, it accelerates the coagulation process. As a result, the decrease in the total particle number is faster. Therefore, this sensitivity study shows that ignoring van der Waals forces in aerosol modeling will underestimate the total number of particles. The coagulation will be more effective when particle number concentration is higher. The effects of turbulent energy dissipation rate on turbulent coagulation kernel Turbulent coagulation originates from particles colliding due to turbulence and aggregation. Kruis and Kusters’, (1997) equations are used for the turbulent coagulation kernel calculations in this study (see more details in Kruis and Kuster, 1997). A critical parameter in these equations is turbulent energy dissipation rate (εk ). During the last several decades, researchers have measured in the stratus clouds, small cumuli, welldeveloped cumuli, deep cumuli and heavy cumulonimbi. Values ranged from 3 cm2/s3 to as high as 2000 cm2/s3 under various conditions in cloudyair and at various locations (see Pruppacher and Klett, (1997), p.584 for more details). The low end of the range is closeto clear air or partly cloudyconditions. Cheng, et al., (1987) measured the oil sands extraction plant in the Fort McMurray area, Canada. According to their observations, the measured mean turbulent energy dissipation rate ranged from 5 cm2/s3 to 120 cm2/s3. When the plume was closer to the source, a very high turbulent energy dissipation rate was measured: cm2/ s3 (i.e. this value is higher in some orders of magnitude compared with clear air turbulent energy dissipation rate). In this study, an εk value of3 cm2/s3 for themodest energy dissipation rate and a rate of 2000 cm2/s3 for the strong dissipation were used. Fig. 7 a to c show how each one of the coagulation kernels vary for the primary particles of radii 0.01 µm, 0.1 µm and 1 µm at the two turbulent energy dissipation rates as a function of different sizes of the second particle. The panels on the left side represent the high turbulent intensity (=2000 cm2/s3) and the panels on the right side represent the low intensity (=3 cm2/s3), that is used in the calculation of the turbulent coagulation kernel. Each figure illustrates the Brownian coagulation kernel including the van der Waals forces, the convective Brownian diffusion enhancement, the coagulation kernel for gravitational collection and the new turbulent kernel. The total coagulation kernel can be calculated as the sum of each kernel. Results indicate that Brownian coagulation is dominant for small particles. For the first particle of 1 µm and the second particles which are larger than 10 µm, when the turbulent intensity is low, the settling dominates; otherwise, the turbulent coagulation kernel becomes more dominant than the settling for the larger particles (Fig. 7 c). The higher turbulent intensity causes the total coagulation kernel to increase. In Fig. 7 c, for the panel with 2000 cm2/s3, there is a dip in the turbulent and total coagulation kernels at 1 µm. This is because the first and second particles are the same size and because their fall velocities become identical; their settling kernels become zero. In general, for strong and modest turbulent intensities (i. e. 2000 cm2/s3, 3 cm2/s3), the effect of the turbulent coagulation kernel is greater for larger particles. A comparison of the intensity results shows that the high intensity case is 1.5 times more important than low intensity. When the turbulent intensity is low, the turbulent coagulation kernel can be ignored, however, when it is high, turbulent intensity can affect the size distribution and it will lead to the underestimation of total coagulation kernel in larger particle size. Discussion of van der Waals impact on particle growth in a highly polluted air Simply, the limiting criteria for determining whether particles can grow due to condensation or coagulation could be determined via comparing loss rates by coagulation to pre-existing particles and growth by condensation. Eq. 12 shows the parameter L that determines the importance of coagulation or condensation on particle growth.
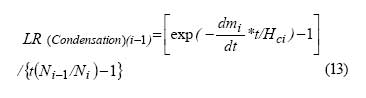
where, LR (Condensation) is condensational loss rate and LR (Coagulation) is coagulation loss rate. Coagulation will dominate for particle growth when L is smaller than one, but will less dominate when L is greater than one. LR (Condensation) can be calculated as follows:
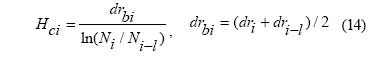
where, LR (Condensation)(i-1) is the rate of particle addition to bin i from bin i-1 and t is the time step. The growth rate is defined by Eq. 14 in this paper and previously by Toon, et al., (1988).
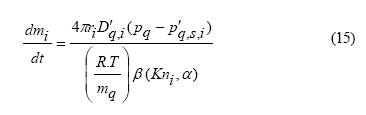
where, R* is the universal gas constant; mq ismolecular weight of species q, pq is the partial pressure exerted by gas q, pq,s,i the saturation vapour pressure over a curved diluted surface. D'q,i is the molecular diffusion coefficient. β(Kni ,α)is the noncontinuum-regime correction factor (Eq. 16) and ri is the radius of drops in bin i. The correction factor is given by (Fuchs and Sutugin, 1971; Pruppacher and Klett, 1997):
where, Kni is the Knudsen number in size bin i and α is the accommodation coefficient, here assumed to be the unity. The coagulation is expressed by the losses of Li from size bin i due to coagulation of particles of size i with particles of all sizes. The coagulation loss rate for particles in size bin i determines how rapidly small particles collide with larger particles through coagulation. For example, each time a particle of size i collides with a larger particle of size j, the resulting particle will be larger than size i. Hence, a particle is lost from size bin i. The rate of disappearance LR (Coagulation) is shown in Eq. 17 (see more details in Toon, et al., (1998) Eqs. (25)- (28)). LR (Coagulatin ) =Ki, jNi, tN j, t −h (17) where, Ki, j is the coagulation coefficient for particle size bins in i and j and Ni and Nj is the number concentration for particles i and j. Particles in bin i are produced when particles in bin i-j coagulate with particles in bin j and h is the time step. Subscripts, t and t-h are the final and initial times, respectively. Both coagulation and growth (condensational) loss rates are calculated with initial particle size distribution (shown in Fig. 2) and are compared as illustrated in Fig. 8. Fig. 8 represents the ratio between coagulation and growth loss rates for different particle sizes as a function of time. The ratio LR (Condensation)/LR (Coagulation), denoted by L, is over 100 to a few thousands. The strong condensational growth occurs when particle size is smaller than 0.01 µm in case time is shorter than 1000 s. The growth of particles by coagulation cannot compete with the growth by condensation unless the number concentration is exceptionally high and the condensing gas concentration is low. Therefore, as a concuction, it can be said that the particle growth is dominated almost entirely by condensation and the inclusions of van der Waals forces will not significantly affect particle growth in the modeled particle size distribution under plume conditions. Van der Waals forces (interparticle interaction) were included in the Brownian coagulation kernel to investigate their impact on particle evolution. The enhancement factor for particle interaction, free molecule limit and continuum limit were calculated using the results achieved by Chan and Mozurkewich, (2001), which are based on Sceats’ theory, (1989). When retardation is taken into account, the enhancement factor is reduced because of the weaker potential at a longer distance. In order to know the region of the retarded interactions, nonretarded and retarded interactions are compared for different particle sizes. When the particle size is large, the difference between nonretarded and retarded enhancement factors increases. The results show that the retarded interactions should be considered for the particles larger than 1 µm, but the Brownian kernel is not dominant for the particle sizes larger than 0.1µm. Thus, the retardation effect can be ignored in a model of aerosol coagulation. Also, the inclusion of van der Waals forces causes the coagulation in particles smaller than 0.1 µm to be accelerated. Ignorance of van der Waals forces in aerosol coagulation modeling will result in an underestimation of the total particle concentration. The results also show that the effect of van der Waals forces is more dominant when the particle number is higher and the particle size is smaller. The impact of including van der Waals forces in the aerosol coagulation process was also investigated in terms of the particle growth in an industrial plume condition. In particle growth under plume condition, the condensation has much stronger effect than coagulation due to the high condensing gas concentration. When the turbulent intensity is higher, the turbulent coagulation kernel plays a more important role in changing the size distribution for the larger particle size range because turbulent intensity is the most significant for the large size range. Furthermore, the turbulent coagulation kernel affects the large particle size range. If ignored, the number of larger particles will be overestimated. The four components of the coagulation kernels were also compared as the functions of particle size. For small particles, Brownian coagulation dominates. For particles larger than 10 µm, the coagulation kernel for settling dominates. In addition, coagulation of a small and large particle is dominated by the convective Brownian diffusion enhancement kernel. The importance of coagulation or condensation process on particle growth was investigated in highly polluted air. As a result, the coagulation loss rate is less dominant than the condensation for the particle growth. Therefore, the inclusions of van der Waals forces will not significantly affect particle growth in the modeled particle size distribution in highly polluted air. The effect of the turbulent coagulation kernel is greater for larger particles. A comparison of the intensity results shows that the high intensitycase is1.5 times more important than the low intensity one. When the turbulent intensity is low, the turbulent coagulation kernel can be ignored, compared to the other coagulation kernels; however, when it is high, the turbulent intensity can affect the size distribution and it will lead to an underestimation of total coagulation kernel in a larger particle size. ACKNOWLEDGEMENTS The authors are extremely grateful to Eric Jensen and Andy Ackerman of NASA/Ames Research Center for making the CARMA model available. Also, they would like to thank Dr. Mozurkewich for his valuable comments and discussions. The financial support from the Natural Sciences and Engineering Council of Canada (NSERC) and the Centre for Research in Earth and Space Technology (CRESTech) is greatly appreciated. REFERENCES
© IRSEN, CEERS, IAU The following images related to this document are available:Photo images[st08001f5.jpg] [st08001f4.jpg] [st08001f2.jpg] [st08001f7.jpg] [st08001f8.jpg] [st08001f1.jpg] [st08001f3.jpg] [st08001f6.jpg] |
| |||||||||
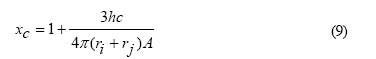
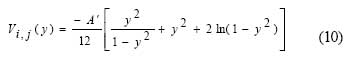
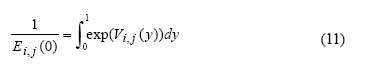
 the disease between the centers of the two particles). In Eqs. (8) and (9), as y increases from 0 to 1, Vi,j (y) decreases from 0 to −∞and the integrand decreases from 1 to 0.
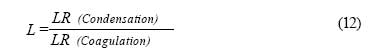
