 |
| About Bioline | All Journals | Testimonials | Membership | News |
|
||||||
|
||||||
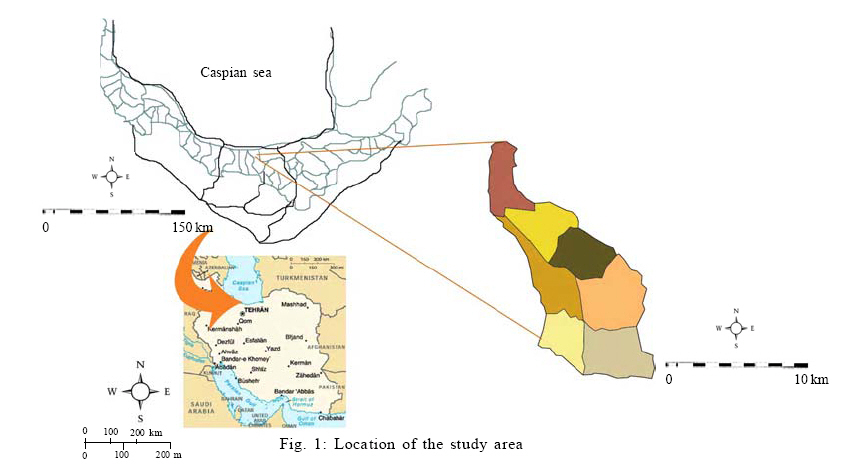
International Journal of Enviornmental Science and Technology, Vol. 6, No. 3, Summer, 2009, pp. 389-394 Comparison of plant species diversity with different plant communities in deciduous forests 1 *J. Eshaghi Rad; 2 M. Manthey; 3 A. Mataji 1 Department of forestry, Faculty of Natural Resources,Urmia University, Iran Received 8 August 2008; revised 19 February 2009; accepted 3 May 2009 Code Number: st09043 ABSTRACT Species diversity is one of the most important indices used for evaluating the sustainability of forest communities. This study aims to characterize the forest communities and to identify and compare the plant species diversity in the study area. For this purpose, 152 relevés were sampled by a randomized-systematic method, using the Braun-Blanquet scale. Classification of the vegetation was conducted by the twinspan algorithm. Four communities, including Querco-Carpinetum betulii, Carpineto-Fagetum Oriental, Rusco-Fagetum Oriental and Fagetum Oriental were recognized. Species richness, Shannon, and Simpson indices were applied to quantify diversity of the different communities. Turkey test was used to investigate the differences in the species richness, diversity and evenness indices among the different communities. The results illustrate that Querco-Carpinetum betulii and Carpineto-Fagetum Oriental communities are significantly more diverse than Rusco-Fagetum Oriental and Fagetum Oriental communities. The spatial structure of the releves becomes more `homogenous' and the dominance structure changes: the proportion of beech-forest species is gradually increasing. At the same time, the number of species per unit area decreases constantly, reaching eventually the value comparable to that recorded for hornbeam forest. Generally, species diversity is inversely correlated with the dominance of shade tolerant climax species. Keywords: Classification; Fagus orientalis; Richness; Shannon index; Simpson index INTRODUCTION Biodiversity is defined as the kinds and numbers of organism and their patterns of distribution (Barnes et al., 1998). Moreover, diversity has become an increasingly popular topic within the discussion of sustainability in the last decade, though the maintenance of diversity of forest ecosystems is required since many years (Schuler, 1998; Swindel et al., 1984). This interesting topic stressed especially in the Rio Declaration and renewed by the Lisbon Conference in 1998 (Neumann and Starlinger, 2001). Generally, biodiversity measurement typically focuses on the species level and species diversity is one of the most important indices which are used for the evaluation of ecosystems at different scales (Ardakani, 2004). Local diversity can be studied with various indices, such as number of species per unit area (species richness) or the Shannon index, amongst other. These are used as indicators of the degree of complexity of the under study communities and provide information on the homeostatic capacity of the system to unforeseen environmental changes (Magurran, 1988). Distinguishing plant communities has been at the heart of vegetation science for centuries, with a traditional focus on the distribution, composition and classification of plant communities (Kashian et al. 2003). Plant communities are defined as an assemblage of functionally similar species populations that occur together in time and space (Magurran, 1988). Plant communities are separated from each other based on indicator species in combination with a distinctive floristic composition. The latter is considered as one of the major distinguishing characters of a community (Dansereau, 1960) and therefore, any depletion of biodiversity is bound to alter the community attributes (Mishra et al., 2004). In the temperate forests, the smallest share of woody species and species diversity could be found both in spruce (Picea abies) and beech (Fagus sylvatica) forests. But, Oak (Quercus robur) forests show the richest species diversity (Hauk, 2005). The Hyrcanian vegetation zone is a green belt stretching over the northern slopes of Alborz mountain ranges and covers the southern coasts of the Caspian Sea. The specific environmental conditions in these forests have been led to occurrence of different forest communities (Sagheb-Talebi, 2004). Plant diversity in conifer forests in Hyrcanian Zone decreases toward high altitude and from west to east (Hoseini, 2000). In this zone species richness and plant diversity of woody species is particularly low in Beech forests (Fagus orientalis) which are due to beech dominance (Porbabaii, 2000). However, plant diversity in tree stratum in beech stands increases with increasing elevation (Fallahchay, 2005). In order to practice silvicultural treatments in different communities, specific plant species diversity need to be characterized. This knowledge helps the forest manager to evaluate performed silvicultural treatments. Modern silvicultural practices stress forest management that combines timber harvesting and biodiversity preservation (Mitchell et al., 2002). One research strategy is to study biodiversity pattern of undisturbed forests and semi-natural woodlands and transfer the knowledge to managed forests (Kuusela, 1993). The study area forests can be considered as semi-natural forests in the Hyrcanian forest belt and have thus been selected for research on biodiversity. So far, no research has been done to indicate and evaluate the plant diversity in different forest communities in Hyrcanian zone, therefore, the aim of this study was firstly to recognize the forest communities in the study area, then identify and compare the plant species diversity in that forest communities. This research was done in the experimental forests of University of Tehran (Iran) during the summer 2006. MATERIALS AND METHODS Study area This research has been carried out during summer 2006 in the experimental forests of University of Tehran located 200 km north of Tehran with a total area of ca. 7000 ha (Fig. 1). The study area is located in latitude between 36, 27- 36, 40 N and in longitude between 51, 32 -51,43E. The landscape is defined by a series of mostly north-south oriented aspects with an altitudinal range from 700 to 1500 a.s.l. The average annual rainfall is 1300 mm and the average annual temperature is 15.3 ºC. Relative humidity is also high with an average value of 80 %. The geological formations are often composed by lime and Dolomite. The main soil categories in the region include alfisols and inseptisols (Sarmadian and Jafari 2001). Sampling strategy The study area was sampled using a randomized-systematic method. Sample sites were located by overlaying a 200 × 200-dot grid on an l: 10,000-scale topographic map of the study area. Potential sample sites occurred on the map at the intersection of a row and column selected from a table of random numbers. The floristic variations could be sampled with this sampling method (Zobeiry, 2002). Floristic sampling was made on a floristically homogeneous surface area with a plot size of 400 m2. In each plot, a full floristic list and an estimate of percent cover of each vascular plant (trees, shrubs and ground layers separately) were being recorded using the scale (Braun-Blanquet , 1932; Mueller-Dombois, 1974). As vegetation is affected by historical factors such as historical management practices and structural parameters (Aude and Lawesson, 1997), the following criteria underlay the selection of the sample plots:
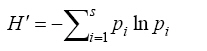
Nomenclature for vascular plants follows Ghahraman (2001). Vegetation analysis method The floristic data matrix consists of 152 sites and 104 species. To classify forest communities present in the study area, the vegetation data were analyzed using two-way indicator species analysis (TWINSPAN) with PC-ORD version 4.14 (McCune and Mefford, 1999). TWINSPAN uses a divisive method of cluster analysis that Gauch and Whittaker (1981) found widely useful. The sites are ordered first by divisive hierarchical clustering, and then the species are clustered based on the classification of samples (Gauch and Whittaker, 1981). An ordered two-way table that expresses succinctly the relationships of the samples and species within the data set is constructed. Major divisions in the data are indicated by a pattern of digits in the margins. The interior of the table contains the abundance class of each species in each sample unit. TWINSPAN seeks groups in species data and reports indicator species for those groups. The stopping point of cluster formation was based on experience and set at the second level for TWINSPAN, which could produce up to four clusters (Macune and Grace, 2003). Measuring plant diversity Species richness index was estimated as the number of species inventoried in the plot. To quantify the diversity of the plant species, the Shannon index (H') as a measure of species abundance and richness is applied. This index which takes both species abundance and species richness into account is sensitive to changes in the importance of the rarest classes (Heuserr, 1998) and is the most commonly used index (Kent and Coker, 1992). For any sample it is calculated as:
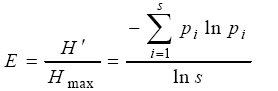
Where, s equals the number of species and is the relative cover of ith species (Whittaker, 1972; Pielou, 1975). In addition, the Simpson index (D) and the evenness index (E=Evenness) are considered as a measure of species dominances and a measure for evenness of spread, respectively (Magurran, 1988). The Simpson index is defined as: D=∑Pi2 As biodiversity increases, the Simpson index decreases. Therefore, to get a clear picture of species dominance D' = 1 - D is used. Whereas, the evenness index (E) is defined as:
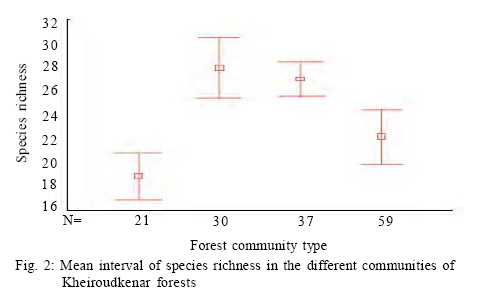
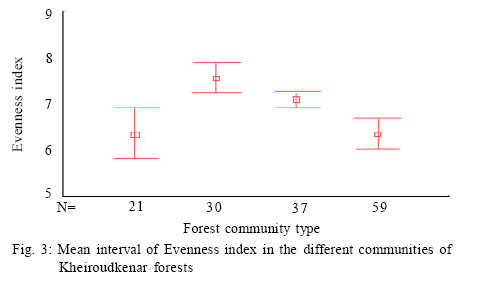
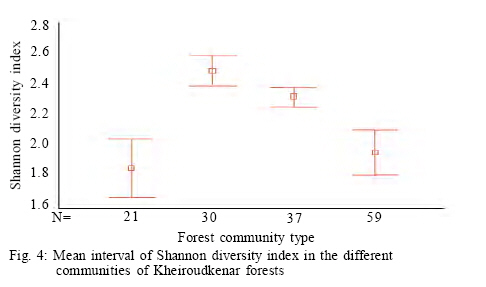
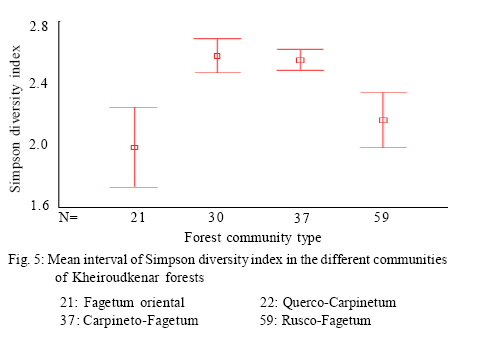
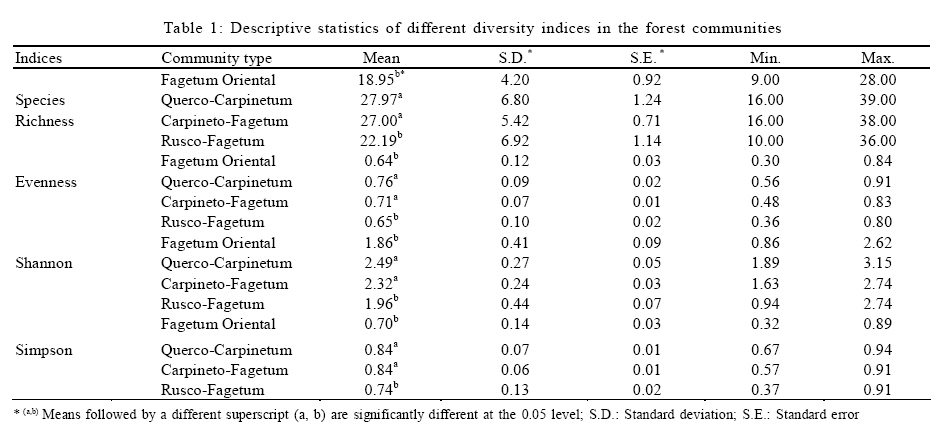
Where, HMAX is the natural logarithm of the total number of species. All diversity indices were calculated using PC-ORD for windows version 4.14 (McCune and Mefford, 1999). Comparison of plant diversity A Turkey test was used to test for significant differences in the species richness, diversity and evenness indices among the different communities. This analysis was conducted using SPSS 12.0. RESULTS AND DISCUSSION 152 samples were established and 104 species were recorded in the study area in different layers including 12 trees, 9 shrubs and 83 herbs. Some of the recorded species have a wide ecological and sociological range of distribution, e.g. Asperula odorata, Euphorbia amygdaloides, Viola odorata, Hypericum androsaemum, all with more than 125 records (> 80 %), while Paeonia wittmanniana Cephalanthera rubra, Lathyrus vernus recorded in 7 or less sites and showed the smallest occurrence (< 4 %). According to the fourth level for TWINSPAN, 152 samples were classified into four communities. The groups included 21, 30, 59 and 37 samples, respectively. Four communities including Querco-Carpinetum betulii, Carpineto-Fagetum Oriental, Rusco-Fagetum Oriental and Fagetum Oriental were recognized in the study area. Each community was named after dominant or indicator species based on the experience of traditional vegetation classification (Atri, 1995). Indicator species in different communities were as follows: Group 1: Querco Carpinetum betulii Quercus castaneifolia, Mespilus germanica, Vincetoxicum scandens, Acer cappadocicum, Prunella vulgaris Group 2: Carpineto Fagetum orientalis Pteridium aquilinum, Lathyrus vernus, Sedum stoloniferum, Carex remota, Milium vernale Group 3: Rusco Fagetum orientalis Ruscus hyrcanus, Daphne mezereum, Hedera pastuchovii, Laurocerasus officinalis, Evonymus latifolia, Frangula grandifolia. Group 4: Fagetum oriental Blechnum spicant, Symphiandra odontosepala, Mercurialis perennis The mean number of woody and herbal species recorded per sampling plot (mean species richness) varied between 28 and 39 in Fagetum Oriental and Querco-Carpinetum, respectively (Fig. 2). The means of species richness of Querco-Carpinetum and Carpineto-Fagetum communities are higher than those of Rusco-Fagetum and Fagetum Oriental. However,The Evenness index of the Fagetum oriental and the Rusco-Fagetum communities is the lowest (Fig. 3). In contrast, this index in Querco-carpinetum and Carpineto-Fagetum is considerably higher. Mean values of Shannon and Simpson indices are very high in Querco-Carpinetum and Carpineto-Fagetum compared to Rusco-Fagetum and Fagetum oriental communities (Figs. 4 and 5). However these indices in Querco-Carpinetum are slightly higher than in Carpineto-Fagetum. According to Table 1, the highest level of all diversity indices belongs to Querco-Carpinetum and the least level could be found in Fagetum oriental. Diversity indices of Carpineto-Fagetum are close to those of Querco-Carpinetum while all Rusco-Fagetum indices are as low as Fagetum Oriental communities. The Tukey test results showed that the mean differences between the group of Fagetum Oriental and Rusco-Fagetum were significant in all diversity indices at the 0.05 level, but there were no significant differences in the different indices between themselves. TWINSPAN quantitative classification method clearly describes the distribution pattern of forest communities in the study area and distinctively classifies the vegetation into four communities. The distribution pattern of forest communities reflects the comprehensive influence of environmental factors. The Querco-Carpinetum community is floristically the richest forest communities in this part of the Hyrcanian forests. Plant diversity decreases with increasing dominance of Fagus orientalis along the order of the communities Carpineto-Fagetum, Rusco-Fagetum and Fagetum Oriental. Here, the proportion of Fagus orientalis-forest species was gradually increasing. At the same time, the number of species per plot was constantly decreasing, reaching eventually the smallest value for Fagetum oriental community. The impact of Fagus orientalis colonization on the surrounding area was significant, due to a considerable deterioration of light conditions of the ground layer. As many indicator species of acidophytic mixed beech-oak forests are light-demanding, they become more abundant in the herb layer with an increasing proportion of oaks in the tree layer (Härdtle et al., 2003). As a reverse trend, these species vanish when the crown density increases, that is to say beneath the strongly shading canopy of the beech tree (Brunet et al., 1997). Receiving high amount of light and thermal conditions to the forest floor in Querco-Carpinetum communities resulted in high density and frequency of the ground layer species. According to Kwiatkowska (1994), Oak forests are floristically the richest forest communities in north-eastern Europe. The condition is the same in Belgium as illustrated by Hauk (Hauk, 2005). CONCLUSION Diversity is of theoretical interest because it can be related to stability, maturity, productivity, evolutionary time, predation pressure and spatial heterogeneity (Hill, 1973). It is also of vital importance for conservation of natural communities which are increasingly threatened by industrial and urban expansions and forest clearing (Naveh and Whittaker, 1980). In the temperate vegetation zone, natural and old growth forests still exist and can be regarded as highly valuable habitats in terms of biodiversity. Temperate forests are extremely variable ecosystems and maintain a high diversity (Dudley, 1992). The results illustrated that Querco-Carpinetum betulii, Carpineto-Fagetum communities were significantly more diverse than Rusco-Fagetum and Fagetum Oriental communities. Generally speaking, species diversity is inversely correlated with stand dominance of shade tolerant climax species. Inappropriate forest management would cause a destruction of most of the forest communities and sometimes may lead to the destruction of their habitats. Forest managers should pay attention to the natural composition of forest communities and should not try to replace pure forest communities by mixed ones. REFERENCES
© IRSEN, CEERS, IAU The following images related to this document are available:Photo images[st09043f4.jpg] [st09043f3.jpg] [st09043f2.jpg] [st09043f1.jpg] [st09043f5.jpg] [st09043t1.jpg] |
| |||||||||